The Anvil 
A place to hammer out ideas
Get Better Results from CausalImpact by Tweaking BSTS
August 26, 2020CausalImpact is an R package that helps analyse the causal effect of an event on a metric of interest.
It is often used by media analysts trying to pinpoint the uplift caused by campaigns or by SEOs wanting to prove their impact to clients.
Mark Edmonson has made a tool called GA Effect where you can try it online with your Google Analytics data.
The output of the analysis can be visualised like this:
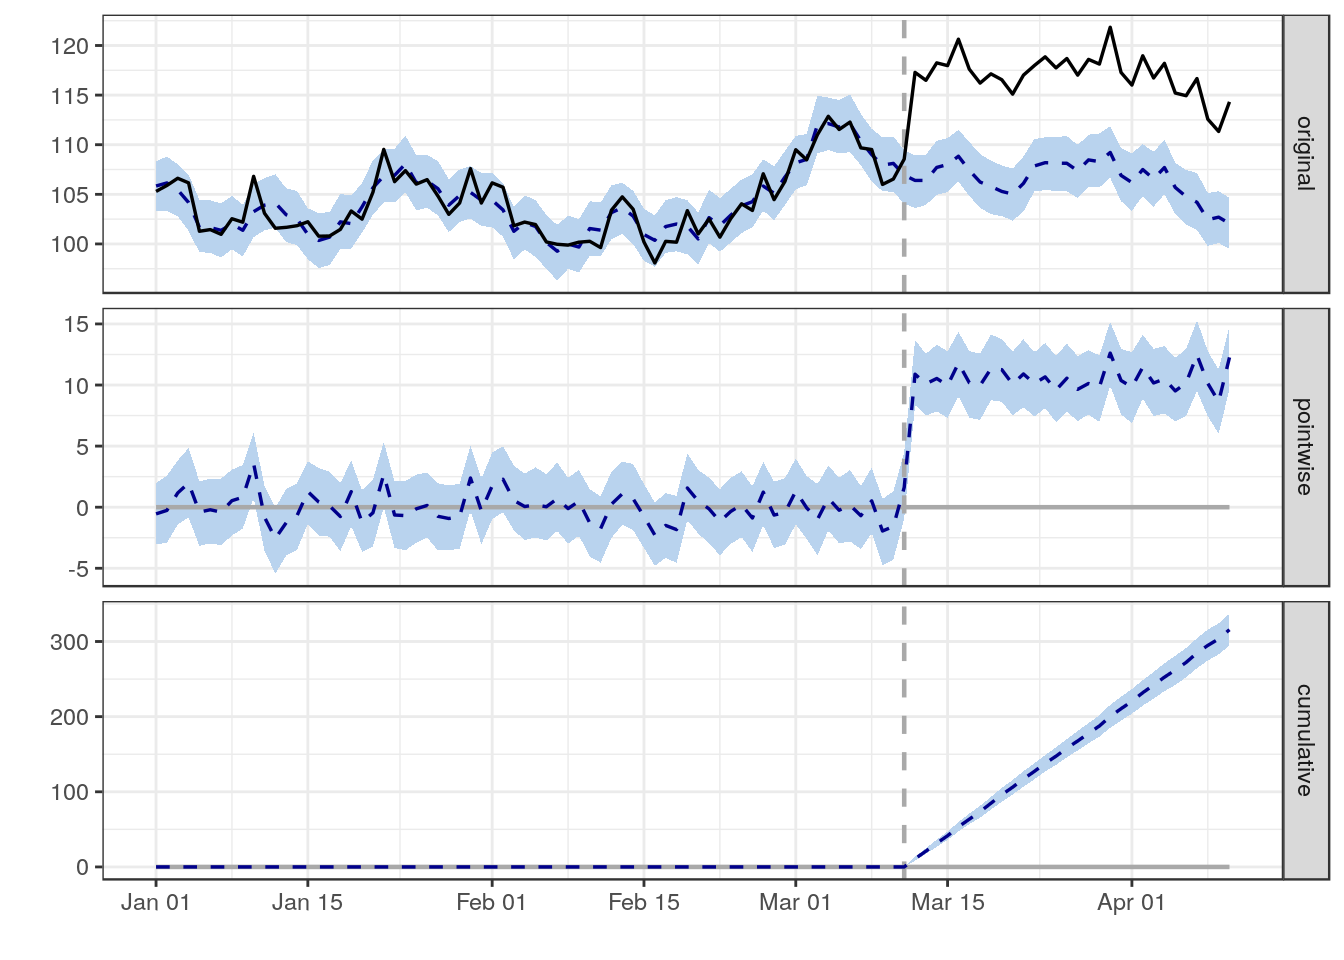
- The first plot shows the actual data (black line) and a forecasted estimate for what would have happened based on the historical data prior to the vertical dotted line.
- The key assumption is that any difference between the forecast and the actuals is because of the change that happened on the day marked by the dotted line.
- The following two charts show the size of the daily effect and the cumulative overall effect.
- The pale blue ribbon is a predictive interval. If this is entirely above or below zero then people will reject the hypothesis that there was no change and conclude that there was a positive/negative impact.
Read more
Launch Week
August 24, 2020On Tuesday last week I casually tweeted about my new Forecast Forge project.
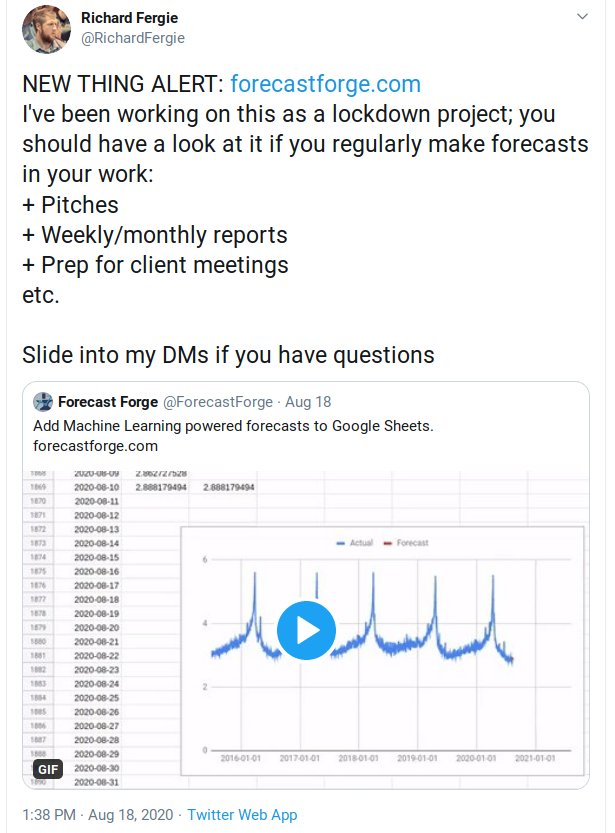
I was hoping to line up a few beta testers to kick the tires and break the addon in new and unexpected ways.
It didn’t quite work out like that.
This is starting to sound like the kind of update where I revel stellar signup numbers off the back of going viral. Spoiler Alert that isn’t what happened.
The Good
I’ve been a fairly heavy Twitter user since late 2008 and the above launch tweet is by far the most popular one I’ve ever had on the platform.
Read more