The Anvil 
A place to hammer out ideas
Working with Google Analytics 4 Data
January 10, 2023For standard (non-Premium) users Google will stop processing new hits after the 1st July 2023. So after this date all your new data will be in Google Analytics 4 and there will be no new data in your Universal Analytics profiles.
Forecast Forge will work just as well with GA4 data as it will with data collected using UA but (and I think you knew there was a “but” coming here) the algorithm does require at least two years of history so that it can make good estimates for how the timeseries varies by season (time of year, day of week etc.). For the earliest of early adopters this is not a problem - GA4 launched at the end of July 2019 - but for most, myself and most of my clients included, Google Analytics 4 properties have been setup within the last two years and there is not yet sufficient data to make good forecasts.
This is a problem. Here are several solutions; the one that is best for you will depend on how much GA4 history you have and how similar your GA4 tracking is to your old UA setup.
Option 1. Don’t Do Anything Fancy
This is a great option if your GA4 data is very similar to your Universal Analytics data.
Simply export your UA data into Google Sheets and then add the new GA4 data at the bottom. Assuming you’ve run UA and GA4 in parallel for a time you still have to make a decision about when the cutoff between the two should be but the good news is that if the GA4 numbers are so similar to UA then it doesn’t matter where this cutoff is; I’d probably include as much GA4 data as possible, i.e. from the date at which it starts to have good quality, but this isn’t necessary to get a decent forecast.
Option 2. Use a Binary Regressor Column
The setup for this is very similar to option 1 above; export your UA data into
Google Sheets and then add the new GA4 data at the bottom. The extra step is to
add an extra regressor column with 0 for all the days with UA data and a 1
for all the days with GA4 data.
This helps the Forecast Forge algorithm distinguish between the UA and GA4 data and learn the difference between them.
Use this option if your GA4 data is different to your UA data by a constant amount (e.g. +250 sessions/day or similar).
Option 3. Use UA Data to Estimate Seasonality
This approach is more complicated and I only recommend using it if you have at least one year of GA4 data and nothing major has changed in the last three months.
First make a forecast using your UA data and then use the historical data plus the forecast as a regressor column for your GA4 data. For this to work the forecast on your UA data must do a good job of representing the seasonal variation in your business.
The idea here is that the seasonality in your GA4 data follows the same pattern as your UA data so you can apply the seasonality estimate from your UA forecast to the GA4 data; the regressor column is what gives Forecast Forge this information.
This method is more complicated than the previous two, but the advantage is that there doesn’t need to be any relationship between the UA data and GA4 data other than that they have the same seasonal pattern. So you can use this option if you want to forecast a new GA4 metric which doesn’t have any equivalent in UA (as long as you are sure about the seasonal pattern).
Option 4. Remove Trend from UA Data First
As with many things, option 3 above ignores some details when the true picture is actually a bit more complicated than that. The UA forecast doesn’t just contain information about seasonality but also an estimate for the future trend; this might be fine or it might be totally not what you want - particularly if there have been any big changes after the end of your UA data.
You want to adjust the UA data so that it only contains the seasonal data and not anything to do with the trend. I have a feature in my backlog to make doing this really easy with the Forecast Decomposition Report but until that launches here is a simple alternative:
Use the TREND function in Google Sheets to estimate a linear trend for your
data. The difference between this trend estimate and your actual data is the
seasonal component. You can see an example of using the TREND function in the
official Google Sheets docs.
You can do this with your entire history of UA data and also for the forecasted
values too but the Forecast Forge trend is more complicated than the TREND
function can fit so I suggest the following approach:
- Use your historical UA data to make a forecast for the next year
- Apply the
TRENDfunction only to this forecasted data - Take the difference between the forecast and the output of
TREND; this is the estimate for the seasonal effect for each day of the year - You can then take this estimate and add it as a regressor column alongside your GA4 data. Be careful to make sure the days match up! (you’ll have to bodge a bit for leap years)
This is way more complicated than the previous three methods so I would only recommend it if the simpler options don’t work. But it is a powerful tool and can be very useful in other circumstances where you don’t have enough data to estimate seasonality; for example you can use it with Google Trends data or sector data from the ONS or another statistics agency.
Read more
Understanding the Forecast Decomposition Report
May 20, 2022Forecast Forge uses what is known as a structural time series model for forecasting which means that your forecast is made up of the sum of several components. For Forecast Forge there are three types of component:
- Trend
- Seasonality
- Regressors
Sometimes you will see a forecast and be confused about why it is predicting what it predicts. Or you think the forecast is bad but you aren’t sure what it is you can do about it.
Being able to see what Forecast Forge has learned for each component can help you with both of these problems but this information was not available… until now!
![]()
Read more
All I Want for Christmas Review
January 5, 2022On November 9th 2021 I made a forecast for the number of pageviews of the wikipedia page for Mariah Carey’s song “All I Want for Christmas is You”.
Now that Christmas is over I can compare my forecast with what actually happened:
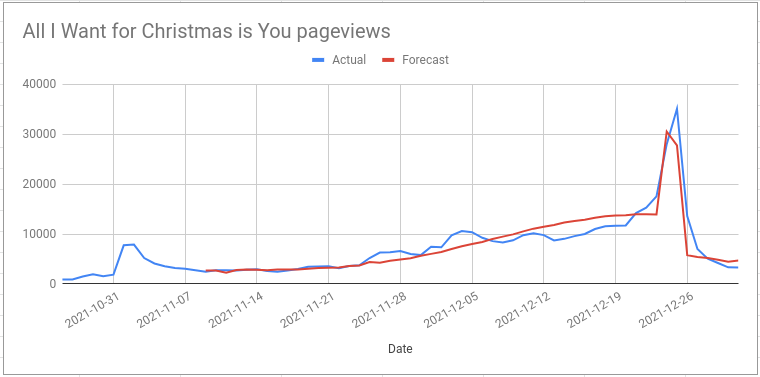
I also made a more specific prediction:
pageviews for the “All I Want For Christmas is You” wikipedia page will peak on 24th December close to 30k
I was right about the number of pageviews on Christmas Eve (28k actual value) but I was wrong about when the peak would be. The true peak was on Christmas day with 35k pageviews.
Read more
Optimising the timing of paid media spend
December 9, 2021What is the best way of splitting a media budget across the year? Two weeks ago I wrote an introduction to forecasting paid media; in this post I will develop the ideas further to show you how to use a machine learning forecasting model to figure out how much you should spend on a channel across the year.
The big idea here is that if you have a forecast that uses daily spend as a regressor column (see the last post for more on this) then you can estimate what would happen in the future if you spent different amounts each day e.g. “what would happen if we spent 10% more on April 12th?”
This can be quite useful by itself but you can take things to another level by asking the computer to test lots of different spend levels on each day in order to find the optimal values. If you have a good forecast model then this process can find the perfect balance between the diminishing returns of increasing spend and the fact that at some times of year there is more demand and higher conversion rates. Very cool!
In this post I will walk you through how to do this. Unfortunately this isn’t possible in the Forecast Forge Google Sheets addon because the addon hides a lot of the model details; I’m working on a solution for this at the moment but it is complicated. Instead I will build the forecast in tensorflow like I did with my most recent attempt to improve my Mariah Carey predictions.
For the training data I will use clicks and spend data from the Google Analytics demo account. This has the advantage of being public data from a real life Google Ads account. But it has some major disadvantages too as we shall see. If you can give me some data that I can anonymise and make public for use in future demos then I will give you a reduced rate for running the kind of analysis you see in this post; email fergie@forecastforge.com if you are interested in this.
The rest of this post weaves code, some outputs generated by the code and my commentary on what is going on together. You can download the Jupyter Notebook if you want to run this example yourself or edit it for your own data. If you do use it with your own data then I highly recommend also editing the forecast model; otherwise I think you will get bad results.
Start by importing some libraries and loading the data
import pandas as pd
import tensorflow.compat.v2 as tf
tf.random.set_global_generator(1111)
tf.enable_v2_behavior()
import tensorflow_probability as tfp
import numpy as np
np.random.seed(1234)

raw = pd.read_csv("google-ads-sample.csv")
raw| Day | Clicks | Cost | |
|---|---|---|---|
| 0 | 2018-01-01 | 302 | $122.93 |
| 1 | 2018-01-02 | 299 | $134.97 |
| 2 | 2018-01-03 | 332 | $134.61 |
| 3 | 2018-01-04 | 345 | $128.13 |
| 4 | 2018-01-05 | 358 | $129.13 |
| … | … | … | … |
| 1419 | 2021-11-20 | 581 | $807.64 |
| 1420 | 2021-11-21 | 474 | $746.14 |
| 1421 | 2021-11-22 | 518 | $727.00 |
| 1422 | 2021-11-23 | 295 | $515.11 |
| 1423 | NaN | 249,269 | $284,602.42 |
1424 rows × 3 columns
I exported far too much data from Google Analytics; in the early years the advertising spend is intermittent with long blocks of no spend at all. It has only been for the last 329 days when there has been consistent activity so we will take this data only for the model.
In the block below I’m also doing some other tidying up (removing the totals row, and converting everything to a number)
from datetime import date
# Remove totals row at the end
raw = raw.drop(1423).drop("Day", axis=1)

# Set data index
ix = pd.date_range(start=date(2018, 1, 1), end=date(2021, 11, 23), freq='D')
raw.index=ix

# Convert everything to a number
raw["Cost"] = raw['Cost'].str.replace('[$,]', '').astype("float")
raw["Clicks"] = raw["Clicks"].str.replace(',', '').astype("float")

# Take only the last 379 days of data
raw = raw[-379:]
raw| Clicks | Cost | |
|---|---|---|
| 2020-11-10 | 39.0 | 24.93 |
| 2020-11-11 | 165.0 | 158.85 |
| 2020-11-12 | 107.0 | 164.09 |
| 2020-11-13 | 109.0 | 176.69 |
| 2020-11-14 | 97.0 | 330.31 |
| … | … | … |
| 2021-11-19 | 495.0 | 759.03 |
| 2021-11-20 | 581.0 | 807.64 |
| 2021-11-21 | 474.0 | 746.14 |
| 2021-11-22 | 518.0 | 727.00 |
| 2021-11-23 | 295.0 | 515.11 |
379 rows × 2 columns
Let’s have a quick look at the data
import seaborn as sns
import matplotlib.pyplot as plt

ax = sns.lineplot(data=raw["Clicks"], color="blue")
ax2 = ax.twinx()
sns.lineplot(data=raw["Cost"], ax=ax2, color="green")
import matplotlib.dates as mdates
ax.xaxis.set_major_locator(mdates.MonthLocator(interval=3))
plt.show()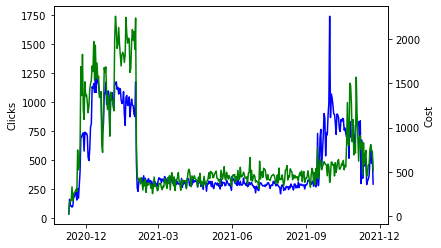
Read more
All I Overfitting for Overfitting is Overfitting
November 23, 2021A couple of weeks ago I used Forecast Forge to build a forecast for the number of pageviews of the “All I Want for Christmas is You” wikipedia page in the run-up to Christmas.
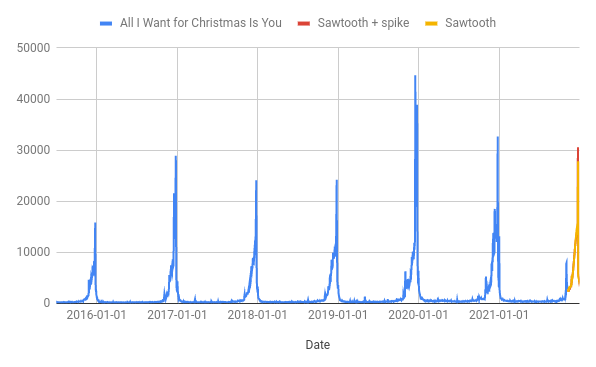
pageviews for the “All I Want For Christmas is You” wikipedia page will peak on 24th December close to 30k
This forecast “looks” good - it has the peak roughly when we’d expect it and the magnitude is comparable with previous years. It passes the smell test, but I am still concerned about whether it predicts the size of the peak correctly. As you can see from the chart, the peak in 2019 was way higher than any of the preceeding years and getting this right is the most important part of my prediction. How can we tell in advance what kind of peak there is going to be?
Read more