The Anvil 
A place to hammer out ideas
Forecasting for Paid Media
November 16, 2021PPC and Google Ads is where I first started in my career so it has a special place in my heart. I have a million ideas on how forecasting and Forecast Forge can help in this industry and they are all logjammed up in my head waiting for me to write “The Ultimate Guide to PPC Forecasting” or something like that.
You could say I’m having some supply chain issues with keeping the blog posts flowing so I thought I’d just get something out there with some of my thoughts even if it isn’t everything.
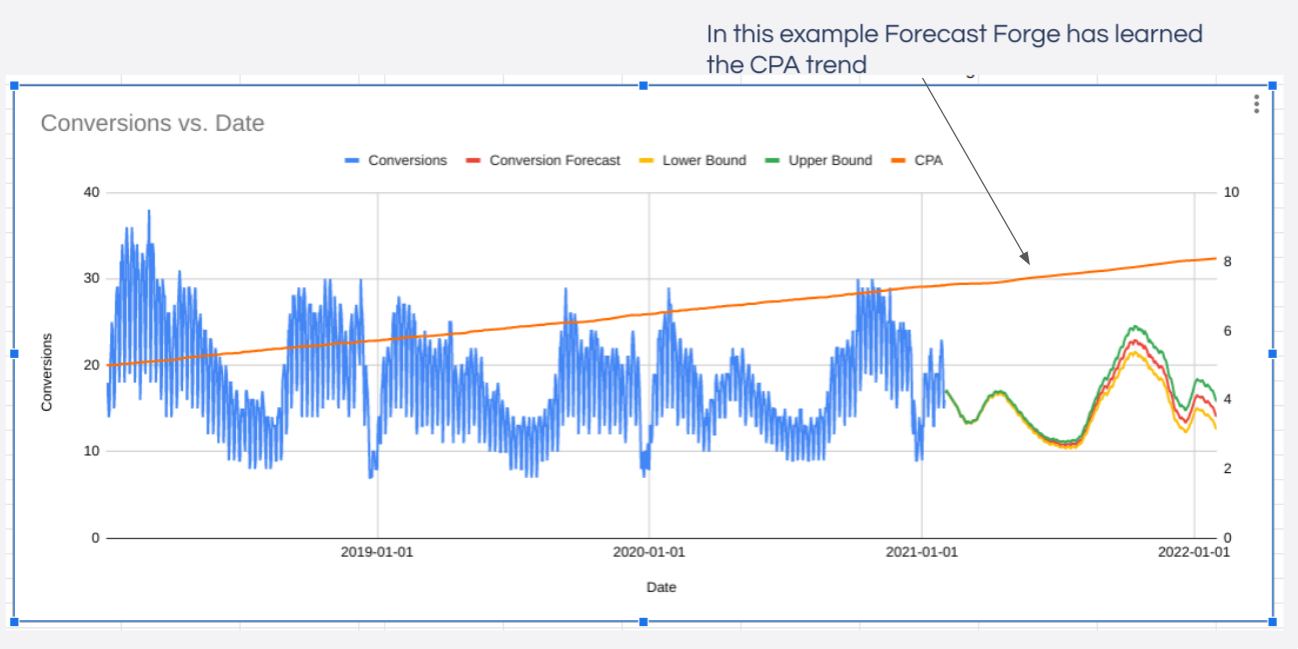
Using Daily Spend as a Regressor Column
When thinking about which factors inflience paid channels one of the most important and most obvious ones is the amount of money you spend! Spend more money, get more clicks/conversions/revenue etc. How much more is an important question which I’ll get to later.
Without data on how much was spent any machine learning algorithm will struggle to tell the difference between changes in budget and other factors (e.g. seasonality, growth in the market etc.). Was June a big month because conversion rates are higher in June or is it just that the budget was a lot higher?
In Forecast Forge you need to specify the values for any regressor columns into the future in order to make a forecast. This is easier with paid media budgets than it is with something like the weather because people generally have a budget plan for the year ahead which can be a good starting point.
Transform the Data
You can think of a very simple model of paid media performance as being something like this:
output = media spend * other stuff
outputis whatever metric you are interested in; normally revenue, conversions or clicksmedia spendis the amount of money you spentother stuffis everything else from cost per clicks to conversion rates and the seasonalities in all these thingsmedia spendandother stuffare multiplied together because if either one of them is zero thenoutputneeds to be zero
One of the good things about machine learning is that we can give is a vague
model like this and it can fill in a lot of the details for us. The big idea
here is that you can train the Forecast Forge algorithm on historical output
and media spend data so that it will learn all the important patterns in the
other stuff.
Read more
All I Want for Christmas is You
November 9, 2021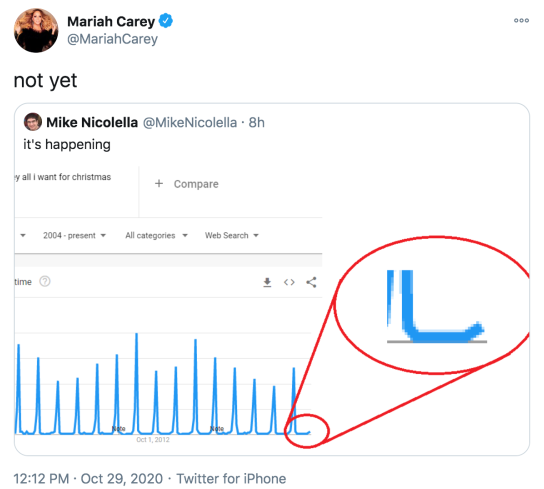
Every year someone notices Google Trends rising for “All I Want for Christmas is You”. It signals the start of the Christmas period for some. How high will it get this year?
Rather than forecast the Google Trend (complicated because the whole scale will be redone if Christmas 2021 is bigger than previous years) let’s look at the amount of traffic to the All I Want for Christmas is You wikipedia page. This data is freely available from Toolforge
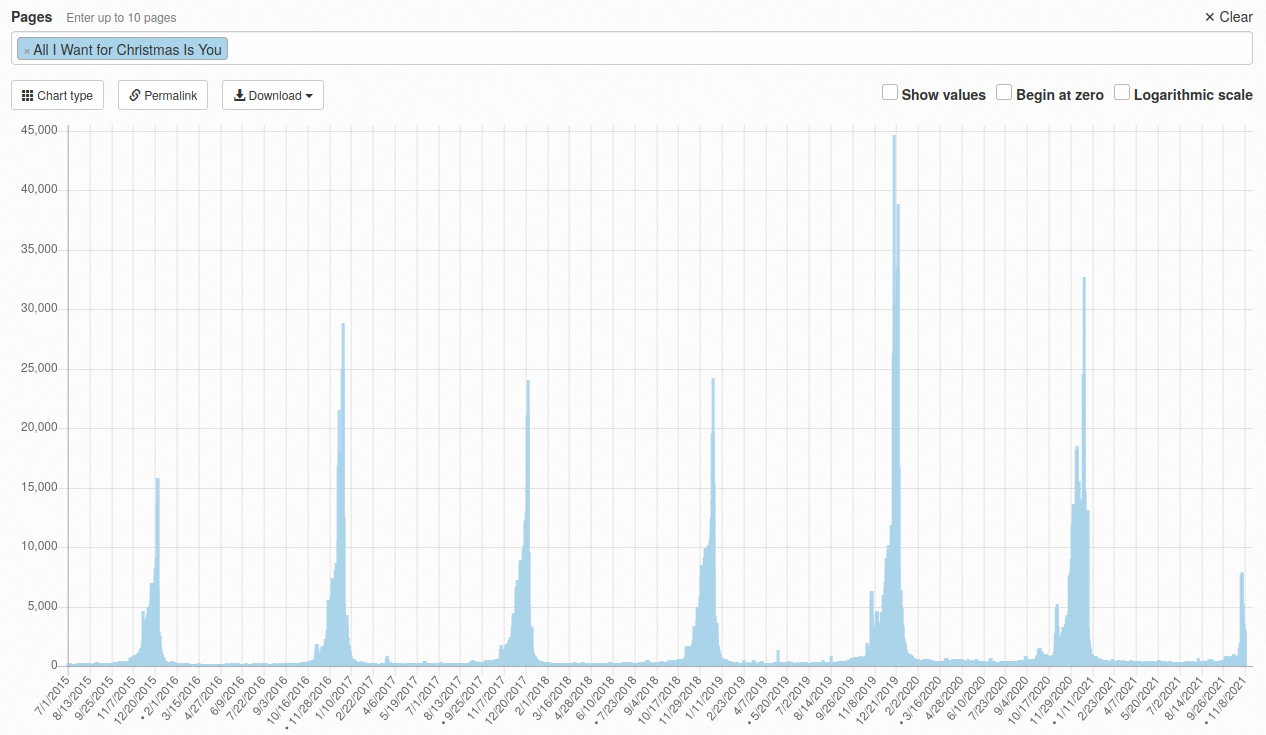
Given this data from 2015 up until yesterday what will the pageviews forecast look like for this year?
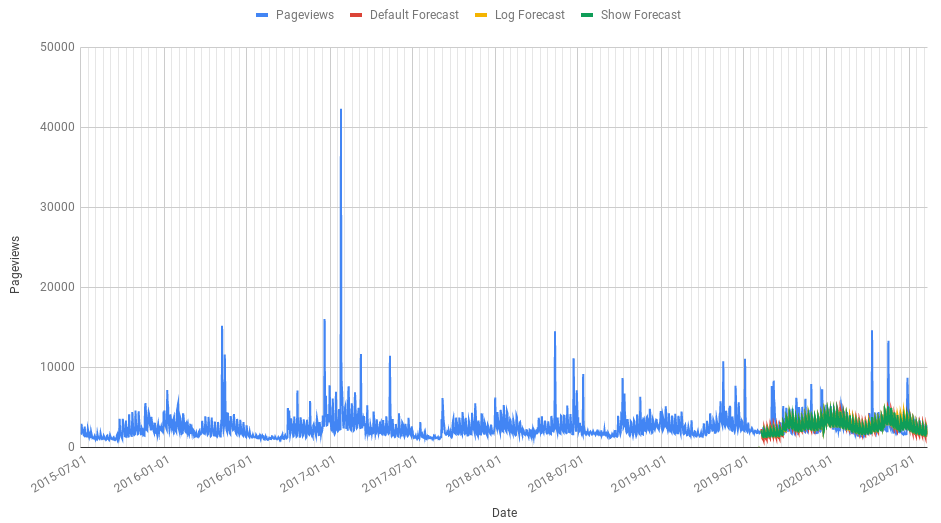
Running the most basic Forecast Forge forecast looks like this:
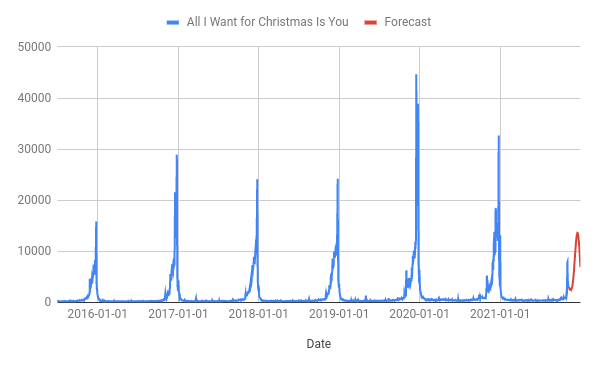
There are a few good things here; the algorithm has clearly learned that something big happens in December and it isn’t doing anything too crazy like predicting negative values. But, it seems to me, that the algorithm is massively underestimating the scale of the “All I Want for Christmas is You”-mania that is likely to happen in 2021.
The above statement is partially me making a judgement call (I think it is possible but unlikely that the wikipedia page will see the lowest levels of traffic since 2015) ad partially me knowing that the default Forecast Forge algorithm will struggle to fit seasonalities as extreme as we see in the training data.
This kind of thing is a tradeoff that all machine learning approaches will have to make somewhere; the flexibility required to fit extreme seasonality like this would also allow the algorithm to overfit in other situations where there is random noise. Unfortunately I can’t just make a few easy tweaks behind the scenes to Forecast Forge and have it magically work for this forecast and all the others. So I’m going to have to get creative to improve things.
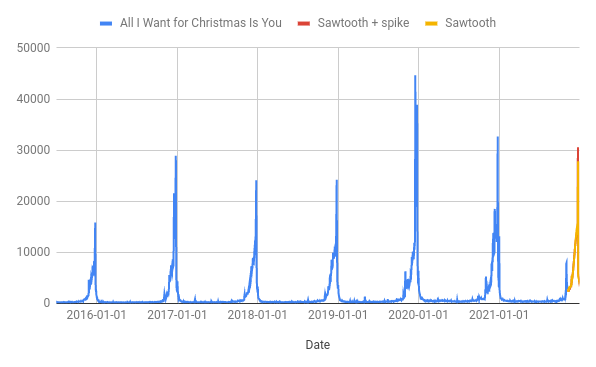
The first thing to do is to look at the chart and try to figure out what kind of seasonal pattern there is.
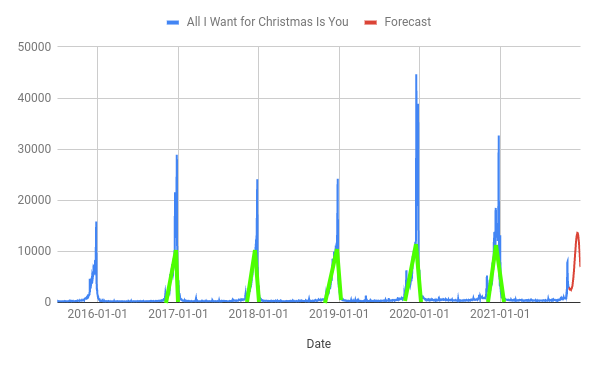
To me, it looks like there is two parts to it:
- A triangular “sawtooth” or sharksfin part that rises in a straigtish line starting roughly at the start of November (in green on the above chart)
- An extra massive spike on top of that a few days before Christmas
You can add regressor columns to help fit both of these patterns as long as the pattern is the same every year; to me, this looks fairly close to the truth for the sawtooth section, but less so for the extra spike.
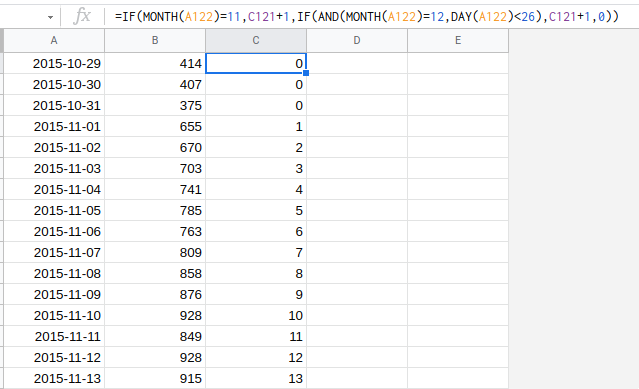
You can easily add a sawtooth regressor by having an ascending count of days since November 1st. The count resets back to zero after December 25th and then starts again on November 1st the next year. The machine learning then makes sure that the slope of the sawtooth in the forecast is the best fit for the training data.
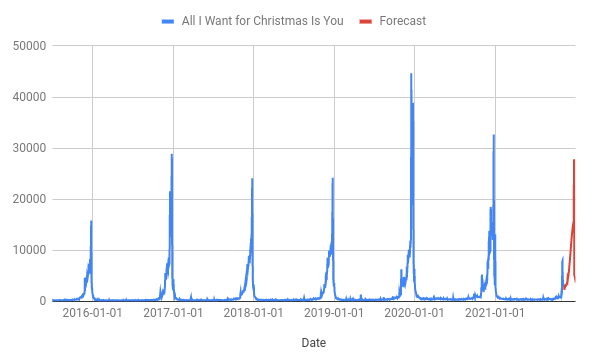
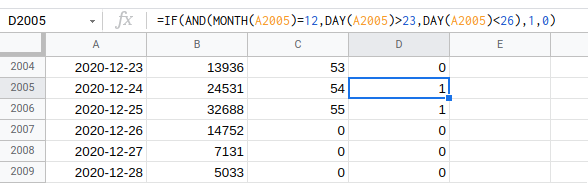
This looks much more like it! Now let’s add another regressor for the big spike. This is a bit more of a judgement call; I’ve added it just for December 24th and 25th but you could spread it out across more days. You could even do a “final week” sawtooth if that was a better fit for the data (the end result would be two sawtooths stacked on top of each other).
The forecast with this method is quite similar to with just the sawtooth but the extra regressor column allows for a slightly higher peak:
There is a bit more work that could be done here; Maria re-released her Merry Christmas album in 2019 which is probably why that year is so high and in 2020 she was in an Apple TV Christmas special. As far as I can figure out this will not be happening in 2021 although she has released a new collaboration with Khalid on November 5th.
My Predictions
Here is the output from the spreadsheet:
| Date | Prediction | Lower | Upper |
|---|---|---|---|
| 2021-11-09 | 2701.5888 | 933.3499 | 4348.9477 |
| 2021-11-10 | 2682.6904 | 854.7259 | 4306.5129 |
| 2021-11-11 | 2242.9998 | 589.6002 | 3947.8674 |
| 2021-11-12 | 2789.1958 | 1155.4217 | 4406.2187 |
| 2021-11-13 | 2884.0697 | 1233.5695 | 4521.535 |
| 2021-11-14 | 2840.468 | 1175.7148 | 4467.9262 |
| 2021-11-15 | 2773.708 | 1131.5298 | 4453.812 |
| 2021-11-16 | 2905.6589 | 1245.4681 | 4539.7813 |
| 2021-11-17 | 2884.595 | 1224.1054 | 4577.9736 |
| 2021-11-18 | 2884.4741 | 1289.0322 | 4562.5815 |
| 2021-11-19 | 3054.9337 | 1390.5864 | 4709.1608 |
| 2021-11-20 | 3217.4772 | 1612.2704 | 4874.9197 |
| 2021-11-21 | 3265.6522 | 1632.845 | 4960.8326 |
| 2021-11-22 | 3314.3094 | 1619.6743 | 4993.7539 |
| 2021-11-23 | 3584.3009 | 1864.77 | 5178.3117 |
| 2021-11-24 | 3722.3373 | 2156.4043 | 5292.8001 |
| 2021-11-25 | 4384.6715 | 2814.9402 | 6022.6639 |
| 2021-11-26 | 4265.1745 | 2614.3949 | 5941.3971 |
| 2021-11-27 | 4635.4638 | 3060.204 | 6283.3784 |
| 2021-11-28 | 4901.2347 | 3226.3424 | 6635.7226 |
| 2021-11-29 | 5173.5339 | 3503.3519 | 6708.9453 |
| 2021-11-30 | 5669.1416 | 4109.9755 | 7399.4489 |
| 2021-12-01 | 6030.5107 | 4343.4766 | 7548.4478 |
| 2021-12-02 | 6425.1478 | 4789.5011 | 8058.7572 |
| 2021-12-03 | 6995.7313 | 5283.9031 | 8609.2387 |
| 2021-12-04 | 7556.4337 | 5908.5305 | 9160.5009 |
| 2021-12-05 | 7993.2462 | 6302.7588 | 9727.1532 |
| 2021-12-06 | 8413.3941 | 6848.6404 | 10127.1566 |
| 2021-12-07 | 9030.1956 | 7443.3617 | 10697.0961 |
| 2021-12-08 | 9483.0803 | 7868.2572 | 11107.7753 |
| 2021-12-09 | 9937.0423 | 8334.207 | 11471.425 |
| 2021-12-10 | 10532.8194 | 8867.4962 | 12239.714 |
| 2021-12-11 | 11083.2638 | 9405.8618 | 12767.5931 |
| 2021-12-12 | 11473.7037 | 9793.7552 | 13088.434 |
| 2021-12-13 | 11811.3794 | 10179.6077 | 13573.654 |
| 2021-12-14 | 12310.3101 | 10745.9551 | 13821.3437 |
| 2021-12-15 | 12611.304 | 10898.2507 | 14210.6269 |
| 2021-12-16 | 12881.3891 | 11313.0435 | 14636.3938 |
| 2021-12-17 | 13263.9547 | 11621.3222 | 14995.5465 |
| 2021-12-18 | 13575.0713 | 11911.9019 | 15199.5681 |
| 2021-12-19 | 13703.7888 | 12058.1878 | 15352.9095 |
| 2021-12-20 | 13761.4983 | 12084.2751 | 15449.1159 |
| 2021-12-21 | 13966.7143 | 12321.3525 | 15731.7209 |
| 2021-12-22 | 13964.9939 | 12298.5484 | 15571.1297 |
| 2021-12-23 | 13928.2702 | 12310.1036 | 15504.8029 |
| 2021-12-24 | 30545.7591 | 28752.9632 | 32184.656 |
| 2021-12-25 | 27777.4519 | 26100.9902 | 29496.8692 |
| 2021-12-26 | 5774.8394 | 4123.2926 | 7438.3634 |
| 2021-12-27 | 5413.7454 | 3782.4206 | 6990.3051 |
| 2021-12-28 | 5219.4467 | 3666.0143 | 6968.5325 |
| 2021-12-29 | 4841.2889 | 3146.788 | 6405.508 |
| 2021-12-30 | 4454.5088 | 2644.2621 | 6213.2783 |
| 2021-12-31 | 4691.3097 | 2973.0348 | 6339.3716 |
A quick, easier to check prediction; pageviews for the “All I Want For Christmas is You” wikipedia page will peak on 24th December close to 30k. I will check in again with how this is looking nearer the time and also show you some other forecasting methods.
Read more
Tips for reducing the width of the predictive interval
October 7, 2021In my last post I talk about how you can use a forecast to measure the impact of a some kind of change (e.g. Google rewriting your title tags in the SERP). One of the main difficulties you might find with this is that the width of the predictive interval is too wide to conclude that a change has had a positive/negative effect with XX% probability.
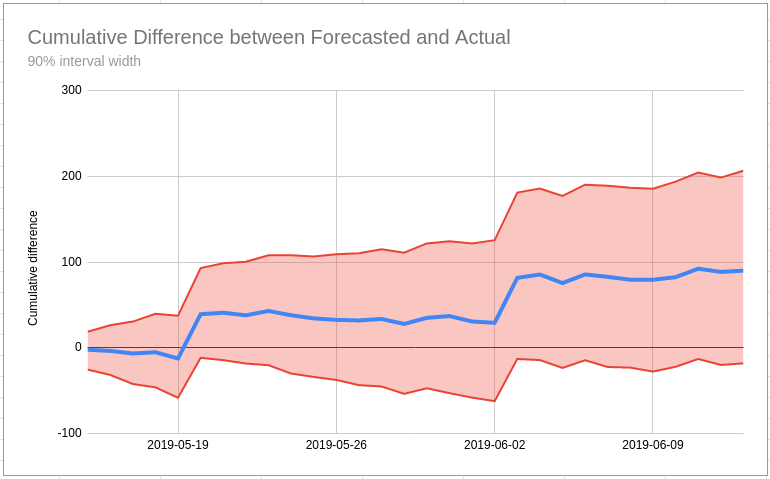
What do you do if your best guess is that the test has a positive outcome but you aren’t 95% sure? Will Critchlow has written about this kind of issue which they sometimes see at Search Pilot. Will has a set of recommendations they use in this situation based around the mantra “we’re doing business, not science” which is an important rule to remember (unless you are a scientist!).
Read more
Measuring the impact of Google's Title Rewrite Change
September 29, 2021Background
On 24th August 2021 Google announced a change in how page title’s would be
displayed in search
results.
The new system means that Google’s machine learning systems will more often
display a custom page title in the links on a search engine results page; before
there was less rewriting being done and the contents of the <title> tag was
more likely to be used.
Barry Schwartz has written a good summary of the ins and outs of this over at Search Engine Land.
As with any algorithm change, Google are saying that this improves results overall but there are some people for whom the new titles seem to be performing significantly worse.
If something is a lot worse or better than it was previously then you don’t need fancy statistics to be able to see that.
Read more
How good will my forecast be?
June 28, 2021One of the challenging things of using a machine learning system like Forecast Forge is learning how much you can trust the results. Obviously the system isn’t 100% infallible so it is important to have an idea of where it can go wrong and how badly it can go wrong when you are talking through a forecast with your boss or clients.
One ways that people familiarise themselves with Forecast Forge is to run a few backtests. A backtest is where you make a forecast for something that has already happened and then you can compare the forecast against the actual values.
For example you might make a forecast for the first six months of 2021 using data from 2020 and earlier. Then you can compare what the forecast said would happen against the real data.
         Use data from this period      To predict here
  ________________________________________~~~~~~~~~~~~~
  |------------|------------|------------|------------|--------????|?????????
2016         2017         2018         2019         2020       Then use the same
                                                               methodology here
Sometimes when you do this you will see the forecast do something dumb and you will think “stupid forecast. That obviously can’t be right because we launched the new range then” or something like that - the reason will probably be very specific to your industry or website. If you can convert your reasoning here into a regressor column then you can use this to make the forecast better.
Read more