The Anvil 
A place to hammer out ideas
Follow up thoughts after #PPCchat
April 15, 2021On Tuesday I was kindly invited to discuss PPC Forecasting as part of the regular #PPCchat Twitter chat. There is a recap put up on the official website.
#PPCchat started just over 10 years ago and, whilst I don’t think I was involved in the very first one I joined the conversation as soon as it was moved to a more convenient time for the UK timezone. It was a very important part of my week for a number of years but I’ve drifted away from the community as my work moved away from hands on PPC management and more towards digital analytics and data science. I was very flattered to be invited to be a guest on the chat and very happy to be able to help a community that has helped me a lot.
The twitter chat format felt a bit frantic so I thought I’d expand on some of the ideas and questions raised here.
The Golden Rules
Before getting into anything too complicated here are what I think the two most important things you can do to get better at forecasting are. They have nothing to do with machine learning or fancy techniques or anything like that; you should be able to apply them regardless of your current process.
- Actually care about being right
- Keep score; check how good your forecasts are against what actually happened and then try to figure out where you went wrong
If you do only these two things then your forecasting will start to improve. And you don’t even need to pay for a Forecast Forge subscription to do them!
Different types of forecast
To help clarify things and avoid talking at cross-purposes (always a risk on Twitter) I split forecasting up into three overlapping areas:
- Forecasting something you’ve never done before (e.g. “we’ve never advertised on LinkedIn; how much will we get from that?”). This is hard and really relies on a lot of hands on experience and marketing expertise for it to work well. Machine Learning of the type that Forecast Forge does isn’t very helpful here - an ML approach that might work is taking data from a lot of people who have done the thing and then trying to figure it out from there
- Forecasting doing more (or less) of something you’ve done a bit of in the past. The big one here is “what if we increased/decreased the budget?”” but it might also be things like turning on retargeting, the site going into sale or above the line ad campaigns (e.g. TV). Forecast Forge can help quite a lot with this kind of thing
- Estimating trends and changes in everything else - e.g. what is the seasonality for CPC and conversion rate? Is overall search volume in this niche going up or down? Forecast Forge can help here too.
Type one forecasts, where you forecast the impact of something new, are a very interesting challenge; the way to approach them from a Machine Learning angle is to collect data from other people who have done the new thing and then try to figure out which of the other people your client is most similar too. This is basically what people do too when they draw on their experience to make an estimate. Forecast Forge doesn’t store your data, know anything about the sector your business is in, or know exactly what metrics you are forecasting so this is not something it supports (there are a few ways you could “hack” this - ask me if you want to test them).
Forecasting doing more or less of something that you’ve already been doing is really important for paid media; this is how you estimate the impact of increasing or decreasing your budgets which is a super-important and frequently demanded forecast for everyone.
Read more
How often should you forecast?
March 22, 2021How often should you be updating forecasts or making new ones? The answer depends on what you mean by “forecast” and can range from “as often as possible” through to something much less frequent.
When you use machine learning to make a forecast there are three parts to it:
- The model
- The parameters
- The data
Making changes to any these could be called “forecasting”.
The three categories are a little bit fuzzy. For example it isn’t totally clear what the boundary is between parameters and model but the basic idea is that you can make very frequent updates for things near the bottom of the list and should be a bit more cautious with things at the top of the list.
This might be easier to understand with an example:
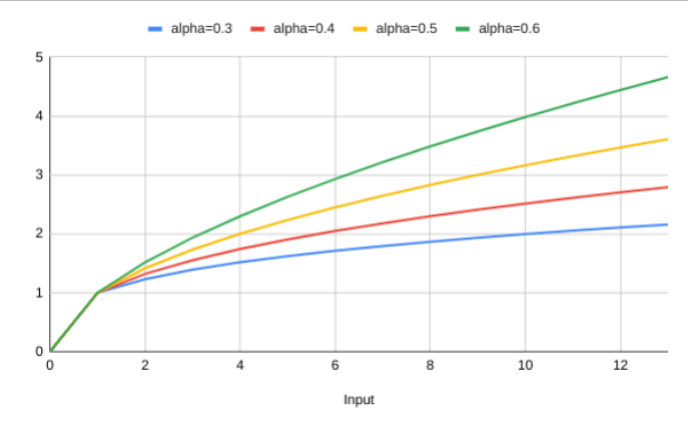
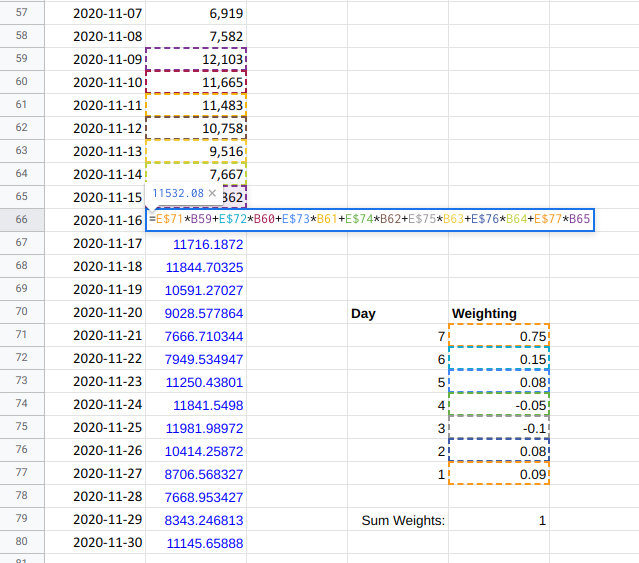
An easy way to make a forecast that includes weekly seasonality is to make the forecast for the next day a weighted sum of the previous seven days. By giving more weight to what happened seven days ago you will see a weekly pattern in the forecast.
Read more
The Forecast Forge Bet and Six Month Update
March 4, 2021Earlier this week I tweeted the below as part of another conversation
My hypothesis with @ForecastForge is that people can make better forecasts using a fairly simple algorithm + their own domain knowledge rather than getting someone else who can make a fancy algorithm but doesn't know the domain
— Richard Fergie (@RichardFergie) March 2, 2021
I thought this would be a good opportunity to unpack my hypotheses about why Forecast Forge is a good/interesting idea. And also a good time to do a quick business update since it has been just over six months since launch.
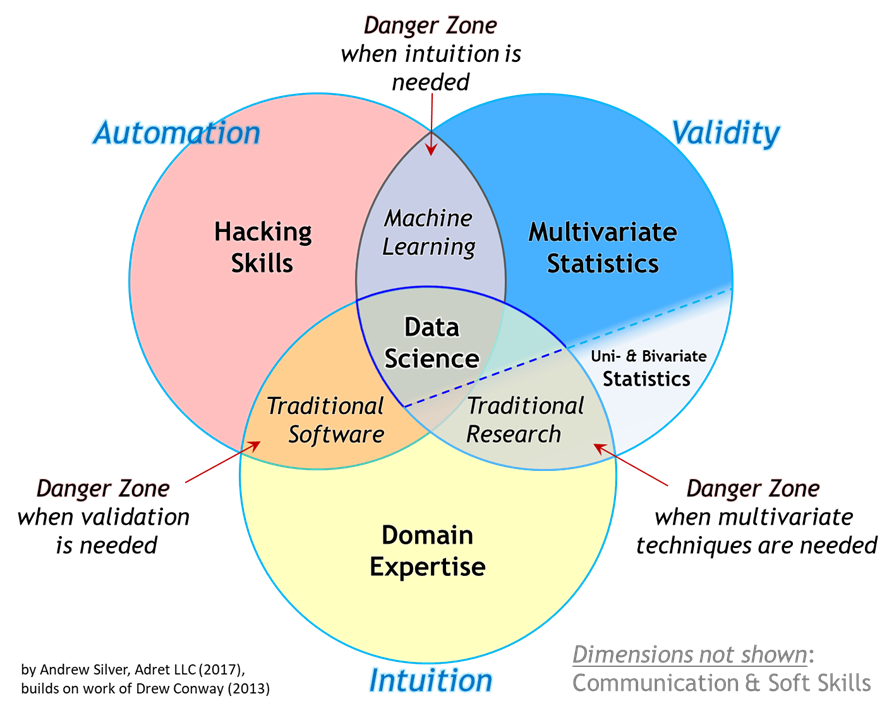
Data Science and Domain Knowledge
Read more
Monthly Forecasts and Missing Data
February 25, 2021One of the most requested feature since Forecast Forge launched has been the ability to forecast from monthly data and not just daily data.
Daily data is really easy to export from Google Analytics and other tools but at a more strategic level no one cares very much about what performance on 14th July looks like as long as July as a whole is doing OK. When planning for the year or months ahead it is much more normal to set a monthly target rather than look at things day by day.
My personal opinion is that working with daily data gives will give better results when you start adding helper columns - particularly helper columns that have an effect on a particular day (this is most of them in my experience). But it is also tedious to make a quick daily forecast and then have to aggregate the results to a monthly level before presenting them to a client or boss and I want to remove as much tedium as possible for my users.

Read more
The "Logistic Mean": Averages for Probabilities
February 3, 2021Earlier today I was enjoying Andrew Charlton’s Probabilistic Thinking in SEO post when I came across something that puzzled me.
Andrew is describing how to combine a probability range (e.g. “we think this will be somewhere between 5% and 60%”) into a single probability. He uses the geometric mean for this:
You can convert your bounds into a point estimate. Taking ‘the average’ will likely be well off, but you can use something called the geometric mean instead. The geometric mean is better suited to data with outliers or extreme variance.
I couldn’t figure out why it was best to use the geometric mean rather than the arithmetic (normal) mean. So I pinged him a direct message to ask.
Andrew kindly explained to me that the geometric mean is useful when you are more interested in ending up in the middle of something that spans several orders of magnitude. For example the arithmetic mean of 1 and 1 million is close enough to 500,000 which is one order of magnitude smaller than 1 million but five orders of magnitude bigger than 1. So in one sense this average is “closer” to 1 million than it is to one.
The geometric mean of these two numbers is sqrt(1*1000000)=1000 which is in
the middle in terms of orders of magnitude. And since Andrew is using these
numbers to make a Fermi estimate where he aims to be within an order of
magnitude of the true value this approach makes perfect sense.
This tweet is where it finally clicked for me:
I see the order of magnitude estimate as "really" an estimate of the log, so GM of estimates makes sense as it corresponds to AM of logs. Still trying to justify the AGM though :-)
— Robert Low (@RobJLow) November 13, 2017
But this got me thinking about probabilities and how we average them. Orders of magnitude are a bit different for probabilities because all probabilities must be between zero and one. It is very similar at the low end where 0.1, 0.01, 0.001 and 0.0001 are all different orders of magnitude but the same is true at the high end too when you look at 0.99, 0.999 and 0.9999.
Consider a service with 99% uptime; it can be down for nearly four days per year.
With 99.9% there must be less than 9 hours downtime per year.
99.99% requires less than 1 hour and a 99.999% SLA requires a maximum of slightly more than 5 minutes of downtime per year.
Normally when dealing with probabilities this kind of problem is dealt with by using a logit transform. We can use this to calculate the “logistic mean” in the same way that a log transform gives us the geometric mean.
The calculation looks like this:
- Calculate the logit of each probability
- Find the arithmetic mean of all these
- Take the inverse logit of this.
Here is the “logistic mean” of 0.9 and 0.999 calculated on Wolfram Alpha. The answer is 0.9896 which is almost exactly 0.99; the middle “order of magnitude” between the inputs.
I haven’t seen this written about anywhere else; probably because I’m not putting the right words for it into Google. But just in case this is something new I thought I’d document it here.
[Andrew has a cool looking SEO Forecasting course that you should have a look at]
Read more