Logit Transforms
The Logit Transform is most useful when the metric you are forecasting has both a ceiling and a floor. For example a forecast for a conversion rate must be between 0% and 100%. Or, the number of users for a site must be between 0 and the total population of the world.
That last one is probably only a concern for Google and Facebook!
In Search you might use this if you have an idea of how many searches are going to be done through the year; the number of impressions you get can’t be higher than this number and it can’t be lower than 0. NB in this example the ceiling cap is variable; the number of searches isn’t the same every day.
For this example I will, again, show you something with Wikipedia pageview data.
This Google Sheet has three columns of data:
- The total number of pageviews for every page in the American politicians killed in duels category
- The number of pageviews for the Alexander Hamilton page
- The proportion of category pageviews which are on the Hamilton page
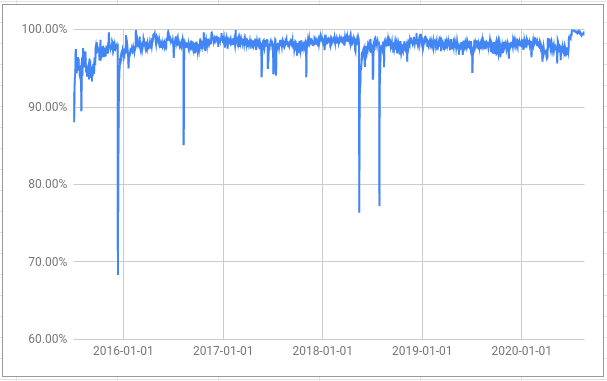
The proportion is what we are interested in here; we know that this can never be less than 0% or more than 100%.
It is always good to start with a simple model just to get a benchmark that we
can try to improve upon. This is in cell E1512 in the demo sheet.
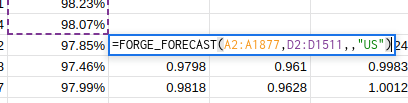
We are quite lucky in this case that none of the expected values of the default forecast are greater than 1.
But there are many days for which the upper estimate of the proportion is greater than one:
This should be impossible and, if we were using the upper bound in some further analysis, it would make all of that analysis invalid.
The solution is to apply a logit transform to the data, make the forecast and then use an inverse logit transform on the forecast results.
To make a logit transform use the function FORGE_LOGIT.
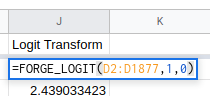
This is in cell J2 in the example sheet. The first argument (D2:D1877) is
the range of cells you want to transform. The second and third arguments are the
ceiling and floor values. If you miss these out they will default to 1 and 0
respectively but I’ve put them in here to make things clearer.
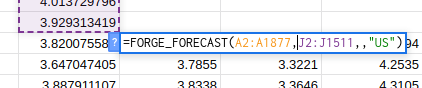
Then make a forecast on the transformed values in the usual way.
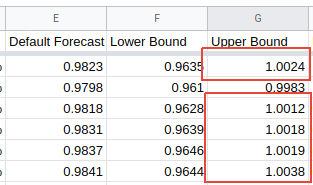
The results of the forecast then need to go through the inverse transform
FORGE_INV_LOGIT. In this example the expected value, the lower bound and the
upper bound are all transformed.
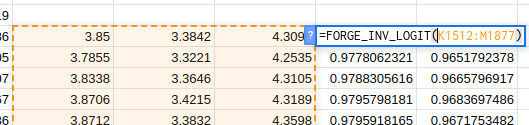
This is in cell N1512 in the example sheet. The first argument (K1512:M1877)
is the range to transform and then, as above, the next two arguments are the
ceiling and the floor for the range. The last two arguments are optional and
default to 1 and 0 if they are left out.
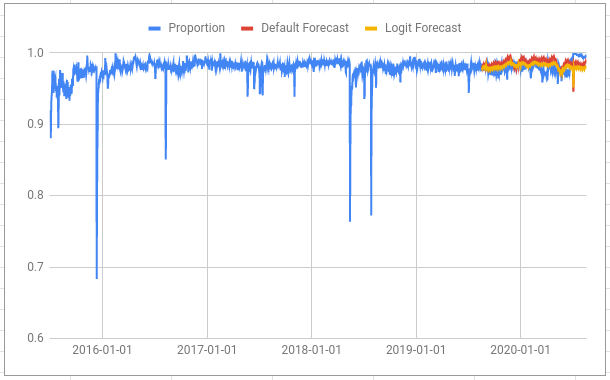
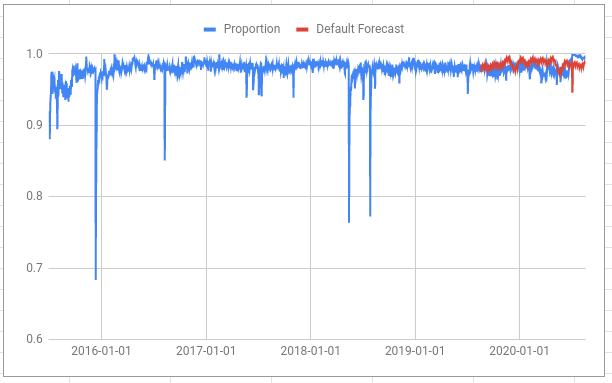
Adding our new forecast to the plot shows that it is quite similar to the default forecast but there is much less variance in the numbers. This is why the yellow line appears “thinner” than the red line.
The logit transform “stretches” space near the floor and the ceiling so, in a sense, a metric must go a lot further to get close to the boundaries.
Compare this chart of the transformed data (blue) and forecast (red) with the chart above:
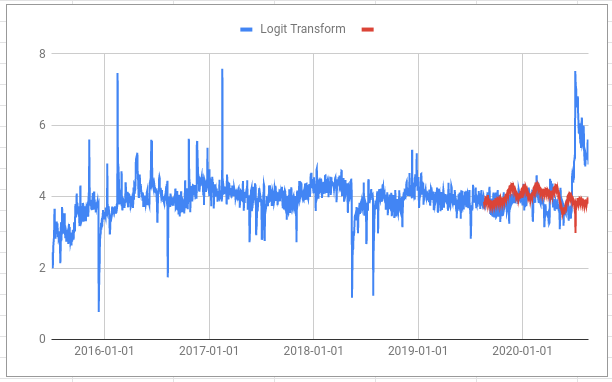
Note how relatively small changes in the direction towards 100% in the first chart (e.g. the rise from late June 2020 onwards) are transformed into big positive changes in the second chart. In fact, reaching 100% on the first chart would look like going all the way to infinity on the second.
And also note how the large drops on the first chart (e.g. on 13th December 2015) are relatively smaller on the second chart. This is because the logit “squashes” space in the middle of the range and “stretches” it at the edges.
As well as being based on a much more sound theory for the problem our logit forecast is also more accurate. Because we are calculating with percentages I chose to use the Mean Absolute Error (MAE) when measuring the accuracy.
- Default forecast MAE: 0.99%
- Logit forecast MAE: 0.71%
The logit forecast performs better too!
Both of those error seem quite low compared to some other examples on the site.
This isn’t because these forecasts are particularly good; it is because we are
using MAE rather than Mean Absolute Percentage Error (MAPE) and because this
data is fairly easy to forecast quite well. If you just make a forecast that
said 95% for every day your MAE would be 3.08%.