Powerful & Custom Forecasts in Your Spreadsheet
Work Together With the Forecasting Algorithm for Best Results
Key Features
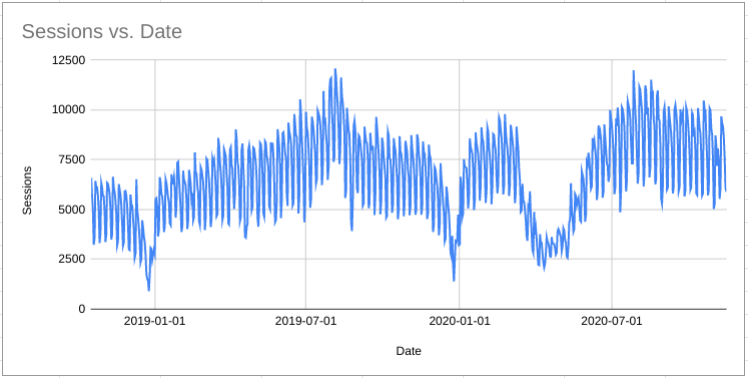
Automatic learning of weekly and annual seasonality
Our algorithm learns the weekly and annual trends that are important for your business.
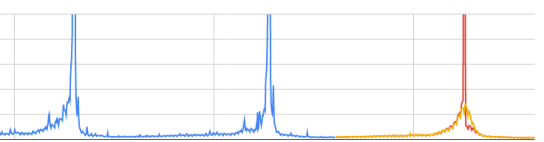
Understands the difference between market and seasonal trends
See the difference between expected seasonal variation and the larger market trends.
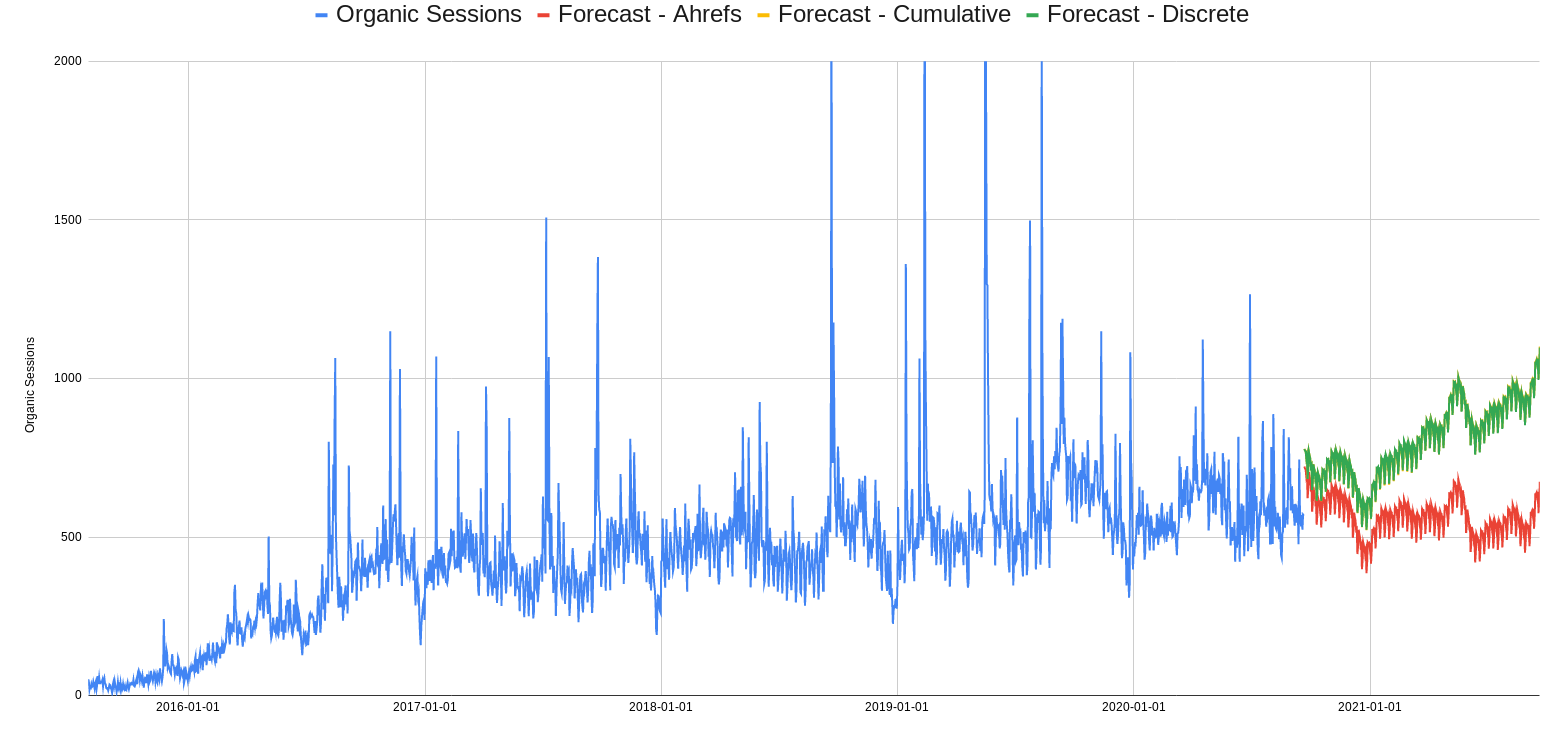
Add "helper columns" to build "what-if?" scenarios
Compare what happens to your forecast under different future plans
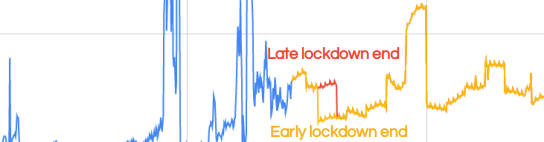
Learns the effect of local holidays
Specify a country and our algorithm will use a country holidays list when it makes predictions.
Use Custom Functions or an Interactive Menu
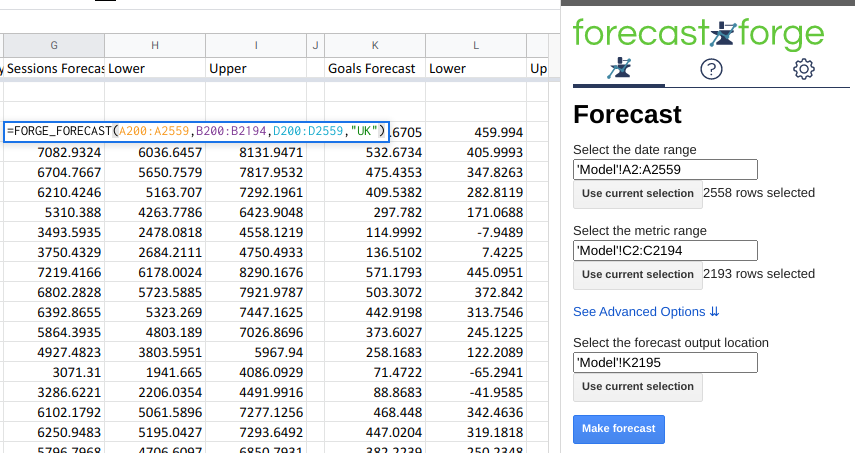
All within Google Sheets!
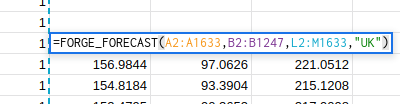
No need to login and import/export your data before you can get down to the real work.
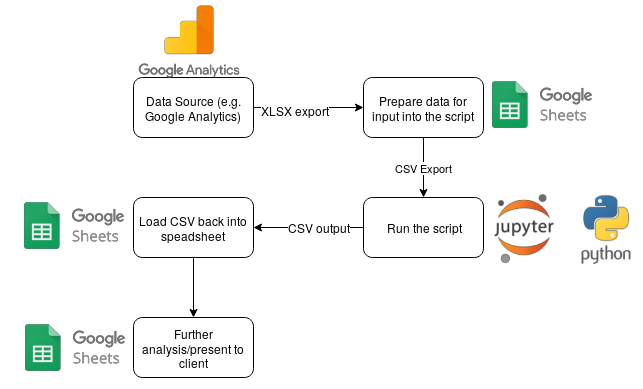
Why a Spreadsheet Addon?
There are two reasons why Forecast Forge works well as a spreadsheet addon:
-
A user interface where people can import data, enrich it with their own information (see details on helper columns below) and interact with the results would end up duplicating a lot of what a spreadsheet does.
Better to let people use all the functionality of their spreadsheet and an interface they are very familiar with.
-
Forecast Forge can be used to make forecasts for a very wide range of different things. And most of this data is either already stored in a spreadsheet or is in a tool that can export to a spreadsheet.
Rather than making the process involve exporting to a spreadsheet from one tool and then importing that into Forecast Forge it is simpler to go to where the data is already; a spreadsheet.
What can  Forecast?
Forecast Forge uses a forecasting algorithm that works well for a wide variety of metrics.
More specifically, the thing you want to forecast should have the following properties:
- Weekly and/or yearly seasonality. These are repeating patterns that occur every week or year. For example "Sunday is a low conversion rate day" or "traffic is always low between Christmas and New Year"
- A week over week or month over month trend that doesn't vary too much and isn't too large. For example, if you are in a stage of true exponential growth then what has happened in the past won't tell you very much about what will happen next year because your company will be completely different by then
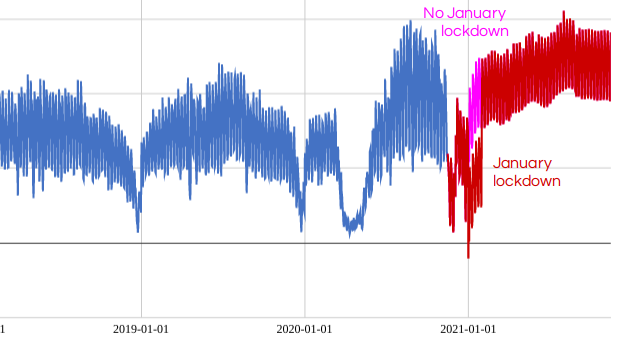
-
Forecast Forge can account for recurring events that don't fit into an exact annual or weekly pattern. Movable feasts like Easter as well as things like product launches and sales fit into this category.
A database of country holidays is included. For other, more specific events, you will have to setup a helper column.
-
Some metrics you want to forecast will have hard constraints. For example, website sessions are always greater than zero and bounce rates are always between 0% and 100%.
Use one of the built in data transforms to make sure the forecasted values meet the constraints.
How Easy is to Customise a Forecast?
There are two parts to this question:
- How easy is it to know what changes to make to improve a forecast?
- How easy is it to make those changes once you know what they are?
Forecast Forge makes the second part very easy; anyone who is a confident spreadsheet user can do it.
The first part is a much harder problem; it requires both a bit of knowledge about forecasting and deeper knowledge of the business you are trying to forecast for.
At the moment I believe there is no easy solution for this and anyone who tells you otherwise either doesn't know what they are talking about or is thinking of a forecasting method with much more limited options for customisation.
This is one reason why this tool is called "Forecast Forge"; you have to hammer at it to get the best results.