The Anvil 
A place to hammer out ideas
MeasureCamp and CRAP Talks; Conference Round Up
February 1, 2021Last month was an unusually social one for me with two virtual events.
First was a long term favourite of mine; MeasureCamp. And then a new one (for me); Bhav Patel’s CRAP Talks.
MeasureCamp
This was my first time attending a virtual MeasureCamp although I knew a bit of what to expect because I had been involved in a test event in lockdown number one.
I presented the following slides to introduce a discussion on “MLUX”; the user experience of working with machine learning.
In summary:
- I am not talking about the consumer UX of products such as newsfeeds, Spotify/Netflix recommendations etc.
- Instead, I am interested in analysts and practitioners as users of machine learning.
- At the moment this splits into two very different groups of users. There are people who can program custom loss functions in Tensorflow and train new algorithms on their own data, and there are those who try to use the results of these algorithms without being able to change them.
- I don’t like this. I think it alienates people in the latter group from their work (often for no good reason) and more and more people are ending up on the wrong side of the divide.
- With new developments like mega-large neural networks it is possible that only a small handful of people will actually understand what is going on with these models and they will all work for three or four companies in Silicon Valley.
- As far as I know there isn’t a perfect solution that fixes all of this at once. In some cases there will be a business imperative to use a third party algorithm that you don’t understand simply because it performs better than any of the alternatives.
- But I hope that there is a gap where more specific domain knowledge of the problem combined with a bit of algorithmic help can lead to a better solution. This is where Forecast Forge sits and, based on what I’ve seen so far I am optimistic!
The discussion that followed didn’t really talk about forecasting at all (which is fine - this is a bigger problem than one area). People expressed frustration with things like product recommendations that lag six months behind the current fashions and the difficulty of comparing the uplift from different ways of doing things.
From one angle it is easy to say that the problem lies in a lack of skills/training for the relevant people. But this will never be a complete solution because there are so few places where one can learn about the development and training of world class models.
In my (biased - look where you are reading this!) opinion improvements in the tooling is more likely to be the best way forward. Libraries like Keras or Huggingface’s transformers allow someone with my level of skill to get started in this area - I would not be able to code or train stuff like this from scratch. And I think similar tooling can and should exist for other people too.
CRAP Talks
In this case CRAP stands for Conversion Rate, Analytics and Product. I have been aware of it as a offline meetup for a few years now but because it is mainly in London and I don’t have a focus on conversion rate optimisation or product analytics I have never made the effort to attend. This is my loss as I thought the virtual event was excellent.
The main part of the event was a presentation from Facebook’s marketing science team about Robyn which is a new open source project they have launched to help with Marketing Mix Modelling.
I have done a small amount of MMM in the past and I wish Robyn had been available then. I was learning as I went along without the support of someone with more experience so I spent a lot of time thinking and worrying about the details of what I was doing and whether or not it was the right approach. A page like this would have saved me so much stress even if didn’t also come with code that does all the calculations for you.
Following this presentation there was a discussion on forecasting which Bhav was kind enough to invite me to be a part of. I think he was hoping for some juicy arguments but (boringly!) I mostly agreed with everyone else. A quick summary of some of the points covered:
- Pick an error metric that matches your business needs and then work to find a forecasting model that minimises it. [I also believe that you should look for a model that is well calibrated in that close to 80% of the data lies within the 80% interval, 90% within the 90% interval etc. But I don’t have strong opinions on how to balance this with the error metric. What to do if one forecast has worse errors but better calibrations?]
- Once you have a model you should stick with it for a bit - how long exactly will depend on your business tempo. You can update the forecasts as frequently as you like but the underlying model should stay the same.
I think I went a bit off piste talking about how your forecast is your “model of the world” but people seemed very tolerant of my ramblings ;-)
I look forward to seeing what else comes out of CRAP Talks in the months and years to come.
Read more
Substitute Days and Broken Machine Learning
January 4, 2021Christmas 2020 was on a Friday which meant that Boxing Day was on a Saturday. In the UK Boxing Day is a public holiday but because it fell on a weekend the following Monday (the 28th December) was a “substitute day” public holiday.
The database of country holidays used by Forecast Forge treats these two things as different holidays. i.e. in 2020 there was a Boxing Day holiday and an extra substitute day Boxing Day on the 28th.
The last year with a substitute Boxing Day was 2015 so unless the historical data used in the forecast includes Christmas 2015 then the Forecast Forge algorithm will not have any relevant training data to make a prediction for the holiday effect in 2020.
I tweeted this observation last week and Peter O’Neill replied with this:
Wait - are you saying that machine learning models will all just break on unexpected days?
— Peter O'Neill (@peter_oneill) December 28, 2020
Which I think is a very interesting question.
The algorithm is behaving exactly as it is designed to so in one (important!) respect it is not broken at all. But on the other hand if it isn’t doing what the user expects then even if it isn’t fair to describe the procedure as “broken” it is certainly far from ideal.
And this gets to the heart of why I think it is an interesting question; it is about how users interact with machine learning systems and what expectations are reasonable for such an interaction. And this is exactly the area where the user interface for Forecast Forge sits!
Let’s talk specifically about the substitute day bank holiday problem even though there must be about a million other similar issues.
Off the top of my head I can think of six different ways of modelling this:
- Ignore it (i.e. treat the 26th as the bank holiday and the substitute day as a normal day)
- Move the entire holiday effect over onto the substitute day
- Apply the same holiday effect to both days (i.e. having a substitute day holiday gives you much more uplift than not)
- Split the holiday effect evenly between the two days
- Split the holiday effect unevenly between the two days. This sounds like a great solution, especially if you can use machine learning to estimate the optimal split. But in practice you will need data from previous substitute bank holidays to do this.
- Treat the substitute holiday as a separate holiday
It isn’t obvious to me that any one of these is always going to be better than all the others.
For a bricks and mortar store I can imagine that, in a non-Covid year, they would get a lot more footfall with a substitute day than in a normal year. For an online brand I can see it not making very much difference - particularly for Boxing Day which lies in the dead period between Christmas and New Year.
The good news is that Forecast Forge allows you to use any of these options by setting up appropriate helper columns. The bad news is that it doesn’t communicate at all about which of the models you are using with the default “country holidays” model.
It is a huge challenge for me to build a user interface that knows when a modelling choice has other options that the user might want to explore. People don’t use Forecast Forge because they want to have to think about this for every possible modelling decision; people like this need to code their own models. But, just as importantly, people do use Forecast Forge because they want a bit more control and customisation rather than a forecasting service where they get the result and can’t do anything about what it says even if it is obviously wrong.
And not knowing what modelling decisions have been made behind the scenes and what other options are possible makes this much harder than I would like for users.
As Peter says:
My argument has always been for a tool that can learn from past behaviour but allow for a human to adjust levers based on known upcoming events using a human estimated weighting
— Peter O'Neill (@peter_oneill) December 28, 2020
And this would be the holy grail for human/machine learning interaction. It already exists for those who are confident with both coding and converting whatever levers a business might want to pull into mathematics. But these people are a rare (and expensive!) breed; I wouldn’t class myself as top tier at either discipline.
I have made design decisions with Forecast Forge that do restrict the levers that are available for pulling. My hope is that I have left the most important levers and that by building it into a spreadsheet all my users have more flexibility in what they can do with it than in other tools.
But it is still short of what I wish it could be. Is there a way to hide the unnecessary complexity whilst making all the necessary complexity visible?
Read more
A Forecasting Workflow
December 2, 2020Here is how I make forecasts using Forecast Forge. There are a lot of similarities with how forecasting is done by data scientists so some of this will be useful even if you aren’t a Forecast Forge subscriber.
1. Look at the data!
I cannot stress enough how important it is to plot the data! For forecasting problems it isn’t even that complicated; putting the date along the x-axis and the metrics you are interested in on the y-axis will be enough in most cases.
Read more
Forecasting the Effect of Lockdowns
November 23, 2020A Covid-19 vaccination is now clearly visible on the horizon but there are still significant uncertainties about when exactly this will become available and what will happen in the meantime.
In the UK I think there is likely to be a period of national lockdown in January. And maybe more in the Spring too. Other countries in Europe are in a similar situation and who knows what will be going on in the USA by then?
It is important for businesses to be able to make good estimates for what their demand will look like at these times. I will show you how to do this in Forecast Forge.
Read more
Cumulative Forecasts and Measuring Impact
November 3, 2020If you have a really good forecasting model that has, historically, produced good results then you can use it to estimate the effect of a change.
For example, physicists can use Newtonian Physics to forecast where planets will be in the sky and things like solar eclipses. If these predictions suddenly started being wrong (after they have been right for hundreds of years) people would conclude that something fairly drastic had changed.
Similarly, if you have made a good forecast in Forecast Forge but then it starts predicting badly this could be because something has changed. You can turn this reasoning around and also say “if something has changed then the forecast won’t work as well.”
You can watch a quick video of me demonstrating how you can do this in Forecast Forge. Or read on below for more details and commentary.
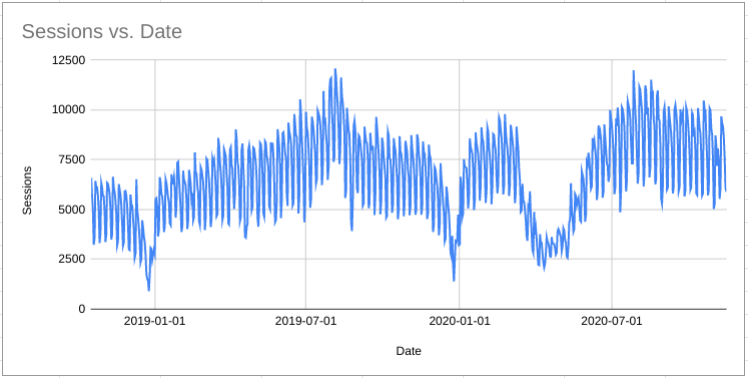
Look at this example of daily transaction data:
![]()
Read more