A Forecasting Workflow
Here is how I make forecasts using Forecast Forge. There are a lot of similarities with how forecasting is done by data scientists so some of this will be useful even if you aren’t a Forecast Forge subscriber.
1. Look at the data!
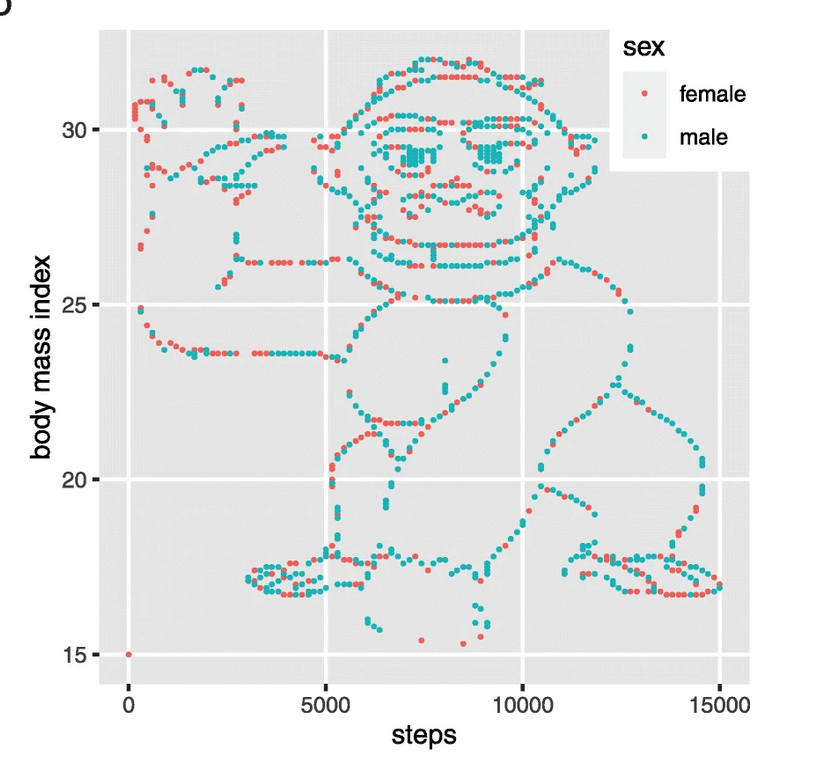
I cannot stress enough how important it is to plot the data! For forecasting problems it isn’t even that complicated; putting the date along the x-axis and the metrics you are interested in on the y-axis will be enough in most cases.
Here are a few things to look for in your plotted data:
1.1 Is there any pattern?
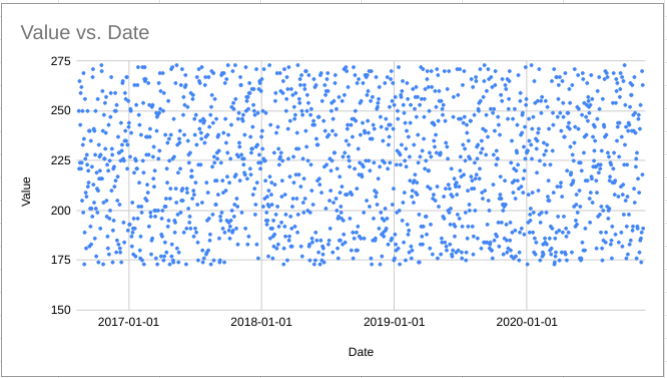
If there is no pattern in the data then machine learning won’t help you make a forecast.
What about patterns that are too subtle for the human eye to spot but which still exist? Fancy algorithms might be able to help you with finding signal in the noise but the algorithm used by Forecast Forge is not one of these.
The patterns that Forecast Forge can find and predict are things like:
- Weekly seasonality
- Annual seasonality
- Trends and changes in trend
- Whatever extra helper columns you give it
You can see a hint of all of these just by looking at a chart.
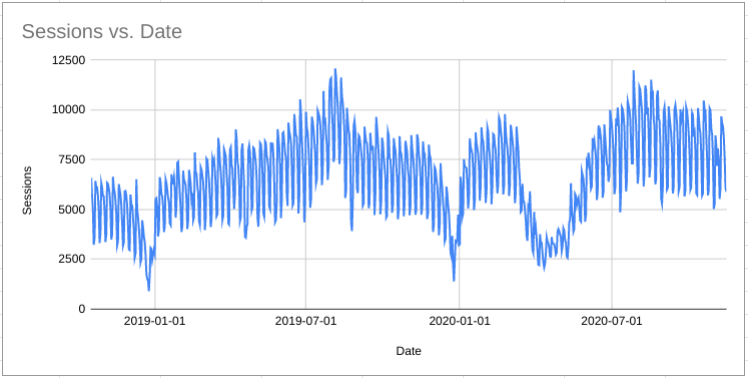
1.2 Are there big peaks or troughs?
Identify the highs and lows in your data. If it is something that occurs more than once try to figure out why. Is it a product launch or a sale? Is it a seasonal event (e.g. black Friday)? Is it because of a Google penalty?
Figuring these things out will give you some ideas for helper columns that can make your forecast better.
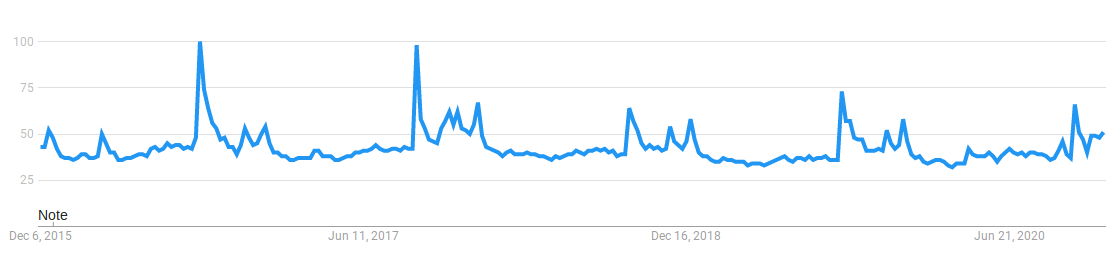
1.3 Does the range of values cover several orders of magnitude?
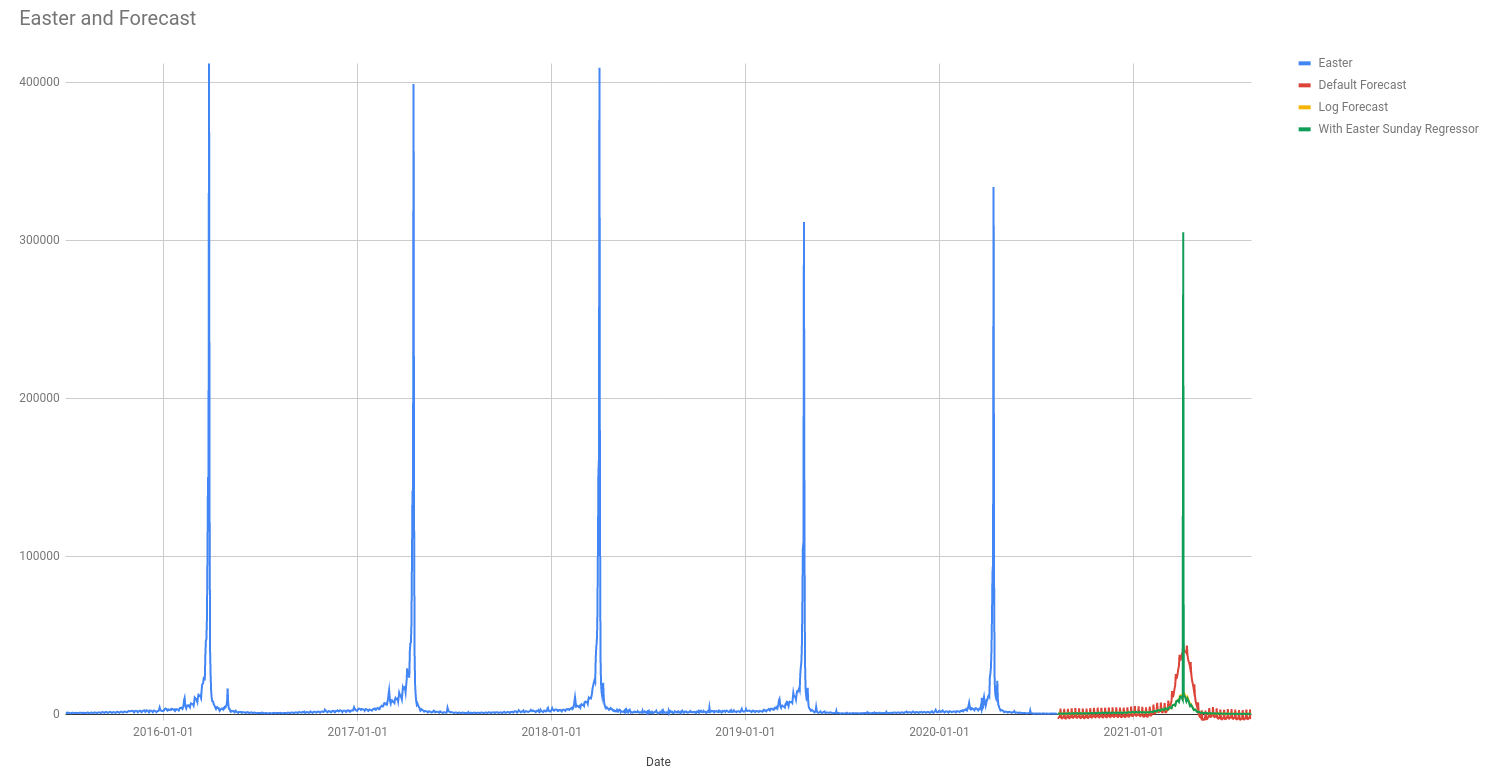
In the above plot of pageviews for the “Easter” article on wikipedia you can see that Easter Sunday is by far the most popular day; it isn’t even close!
This kind of extreme value can be difficult for Forecast Forge to deal with. There are a few things to be aware of if you see this kind of thing in your data:
- Forecasting the total pageviews for the year depends mostly on getting the
Easter Sunday figure correct; you can forecast every other day as
0and the total won’t be too far off. The Forecast Forge algorithm doesn’t work well in this situation. Making a more manual forecast for Easter Sunday and then using Forecast Forge for the other 364 days of the year. - Data transforms can help in this situation because they help “squash” the data into something that is easier for the algorithm to handle
- You definitely want to add separate helper columns for the dates of your important events. Forecast Forge is limited in how “spiky” the seasonalities it can fit are. This is necessary to prevent overfitting but if you know a good reason for the spike to be there then this shouldn’t be a problem.
1.4 Are there periods of anomalous or weird data?
This could be because of something in the real world (e.g. lockdowns) or it
could be an artifact of the data collection method (e.g. broken tracking).
Either way, you want to identify these periods and then control for them by
using a helper column; 1 for during the special period and 0 otherwise is a
good starting point for this.
2. Choose and appropriate error metric and duration
I’ve written elsewhere about some of the possible error metrics you could use and the pros and cons of each of them.
Another thing to consider is the duration of the forecast and the granularity of the results.
If you are forecasting for the year ahead the Forecast Forge will give you 365 forecasted days. But often you don’t care too much about the daily results except for a few key days in the year (e.g. Black Friday); it is more normal to care about weekly or monthly results when looking at a forecast for a whole year.
Which means you should aim to find a forecast with the lowest error taken over the period of interest (weekly or monthly) rather than the forecast with the lowest daily error.
The daily forecast with both over- and under-estimate the true values; you should expect /relatively/ better error metrics over weeks or months compared to daily. This is because over- and under-estimates will, to an extent, cancel each other out.
3. Play around with stuff
When you know what you are looking for, have a play around to see how low you can make your chosen error estimate.
I like to use the sidebar for this because it automatically calculates error estimates and it is easy to change settings and add transformations.
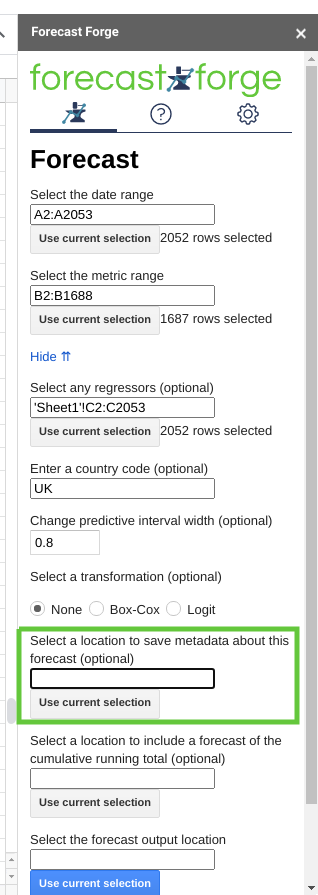
You can use the sidebar to write your forecast settings and accuracy results into the spreadsheet. Just fill in the cell where you want to save this information in the input field highlighted above.
The output looks like this:
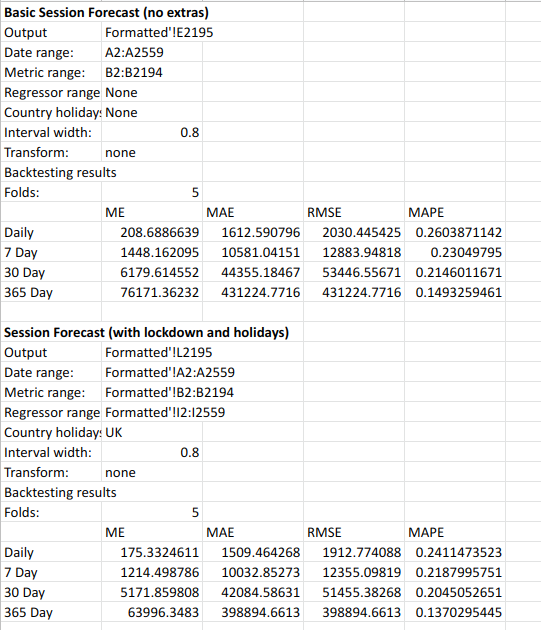
This shows that a forecast using UK holidays and a helper column for lockdowns outperforms the basic default forecast.
I would also test different transformations at this time to see if they help.
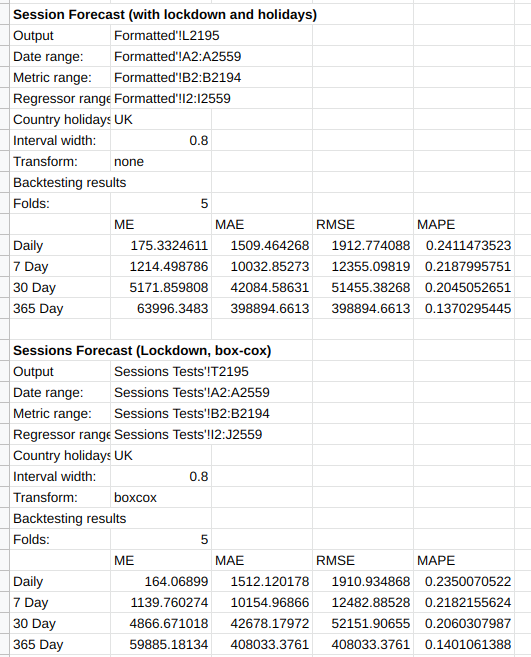
In this case, adding in a Box-Cox transform helps improve MAPE at the daily level but not at the yearly level.
More Advanced Techniques
If, after trying all of the above, your errors are still too big or you have more time to make a really good forecast the next step is to try and figure out where the opportunities for improvement are.
To do this you need to make a few forecasts for historical periods where you know what the actual values are. Then calculate the residuals (the difference between the forecasted and the actual values).
Plot the residuals and see if there are any patterns you can spot.
Are there certain times of year when the forecast does badly?
Does this suggest some events that you haven’t considered?
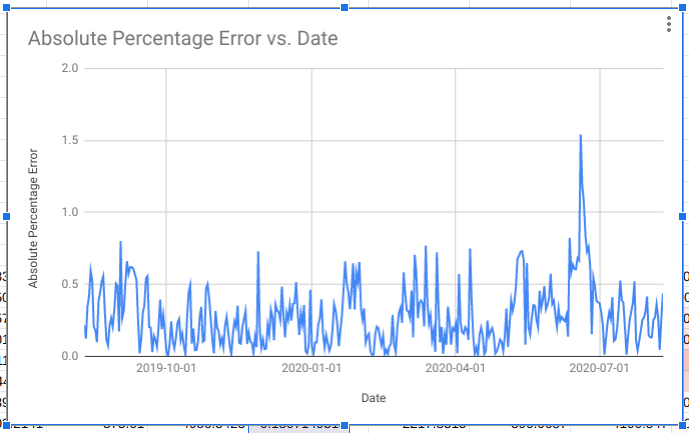
This chart suggests that the forecast was very wrong in May/June 2020. If you can figure out what was going on here and improve the error for these months then you will have a much better forecast.
4. Make the forecast
Once you have taken the above steps and figured out what forecasting methodology you want to use then use it to make the forecast (duh!).
Be aware that if you then look at the forecasted values and decide to go back and change the methodology you have entered the garden of forking paths (in the linked paper Gelman is mainly talking about p-hacking but this still applies to any kind of manipulation of methodology to achieve a desirable result).
There might be good reasons for doing this, but you should be aware that you are on riskier ground and need to tread carefully.
One example where I did this myself recently was for a client who has been heavily effected by both the lockdown and the furlough scheme.
When I’m making an annual forecast I need to hold out at least a year of data in order to compare the forecast predictions with something from the real world. Which means that there are no days with lockdown or furlough in the training data for my backtest; so it is unknown how good the model is at dealing with these things.
“The usefulness of a theory is customarily assessed by tentatively adopting it, and then considering whether its consequences agree with common sense, and whether they provide insight where common sense fails.”
– George Box
Unfortunately I can’t share the charts with you in this case but the forecasted results were very different depending on whether or not I considered just lockdown or lockdown and furlough together. But choosing between these two models isn’t so easy when I can’t make a comparison between the forecast and real world data. In the end I showed both to the client to get their opinions on the matter.
In some ways this is dodging my responsibilities as an analyst but in other ways they know their business and their industry much better than I do.