Backtesting Forecasts to Estimate Future Accuracy
There are lots of things you can do when preparing a forecast but how do you know the things you should do?
You want the forecasting methods that will produce the best predictions about the future but, and this is the tricky part, you need to pick a method now; before you know anything about the future values.
One way to get more confidence that you are picking the best method is to “backtest” your methodology against historical data.
For example, you might pretend you don’t know what happened between April 2019 and April 2020 (and I think we’d all like to imagine this didn’t happen at all!) and use the data from April 2017 to March 2019 to feed into the forecasting algorithm.
Then you can compare the results of this forecast with the actual data for 2019/20 to see if the changes you are making to inputs or methodology are making the forecast better.
         Use data from this period      To predict here
  ________________________________________~~~~~~~~~~~~~
  |------------|------------|------------|------------|--------????|?????????
2016         2017         2018         2019         2020       Then use the same
                                                               methodology here
Picking an error metric
There are a few common ways of measuring how bad a forecast is. You need to match your error method with the goal of the forecast you are making and then you can work at improving things until you feel able to pick the forecast with the lowest error.
1. Mean error (ME)
For each day in the forecast, calculate the difference between the forecasted value and the actual value. Then find the mean of all these values.
If the value is positive then your forecast tends to underestimate and if it is negative it tends to overestimate the true values.
This error metric is rarely used by itself because you can have a forecast that is always a very long way from the true value but, as long as the positive and negative errors cancel out, the mean error can be very low. I’ve included it in this list only because it is the simplest error metric.
2. Mean absolute error (MAE)
This is very similar to the above except you use the absolute value to make all the daily errors positive before you find the mean. This fixes the problem of positive and negative errors balancing each other out and makes for a nice easy way of explaining how good or bad a forecast is.
3. Mean squared error (MSE)
Another way to transform the error values (also known as “residuals”) into a positive number is to square them rather than use the absolute value function.
Be aware than this means a few large errors can cause this metric to “blow up” in a way that MAE doesn’t.
| Day | Actual | Forecast |
|---|---|---|
| 2020-08-01 | 100 | 102 |
| 2020-08-02 | 95 | 97 |
| 2020-08-03 | 99 | 97 |
| 2020-08-04 | 80 | 69 |
| 2020-08-05 | 81 | 79 |
| 2020-08-06 | 98 | 101 |
| 2020-08-07 | 105 | 104 |
The MAE for this forecast is (2+2+11+2+3+1)/7 = 22/7 ~= pi
The MSE is (4+4+121+4+9+1)/7 = 143/7
The important thing to see here isn’t that the MSE is much bigger. The important
thing to notice is the huge difference in the proportion of the error that comes
from 2020-08-04; for the MSE 121 is sooooo much bigger than all the other
squared error values.
Mean squared error is much more sensitive to outliers than mean absolute error. A forecast that is mostly right but sometimes very wrong will score worse here than a forecast that is more consistently wrong.
MSE also has theoretical importance for two main reasons:
- In a lot of cases minimising MSE is equivalent to maximising the likelihood of a model with normally distributed residuals. Normally distributed residuals is a very common assumption across lots of data science.
- The error function is differentiable everywhere which is important for machine learning algorithms like gradient descent.
Neither of these things should concern you as users of the forecasting addon but they are important if you want to improve your general knowledge in this area.
4. Mean absolute percentage error (MAPE)
Imagine I tell you that I’ve made a forecast for average order value (AOV) and
that my MAE is 15. Is this good or bad?
It is impossible to say without knowing more about the average order value. If
it is very high (e.g. over $200) then 15 is quite good. If it is very low
(e.g. $20) then 15 is very bad!
Calculating a percentage error avoids this problem because the error is scaled with the value of the thing you are trying to forecast. A percentage is also much more commonly understood than an MSE value which helps when communicating with stakeholders who aren’t armpit deep in the details of forecasting.
However, if the real values vary over a wide range then MAPE can suffer from similar problems to MSE:
| Day | Actual | Forecast |
|---|---|---|
| 2020-08-01 | 100 | 101 |
| 2020-08-02 | 95 | 110 |
| 2020-08-03 | 99 | 90 |
| 2020-08-04 | 1 | 5 |
| 2020-08-05 | 81 | 79 |
| 2020-08-06 | 98 | 88 |
| 2020-08-07 | 105 | 94 |
The MAE for this forecasts is (1+15+9+4+2+10+11)/7 = 52/7 ~= 7.43
The MAPE is (1%+15.8%+9.1%+400%+2.5%+10.2%+10.5%)/7 = 446/7 ~= 63.8%
Because the value on 2020-08-04 is of a different magnitude than the rest it’s
contribution to the MAPE is disproportionately large even though the error is
only 4.
This won’t be a problem for you in real life unless you regularly see some values that are much smaller than the rest. This might happen in a rapidly growing business (the forecast would bias towards making better predictions at the start of the growth curve rather than further in the future) or if you are forecasting something that is rare except in a particular season.
5. Weighted variants of the above
All of the above methods can be adjusted to give more weight to errors at particular times of year.
For example, you might weight errors in Q4 more heavily because this is a particularly important time of year to get right.
6. Aggregate variants of the above
The forecasting addon produces daily forecasts but often you don’t care very much about the daily values; it is more important to get the weekly or monthly totals correct.
In this case, you can calculate the actual totals and the totals for the forecast and then use one of the above error metrics on them.
Normally an aggregate error metric will be lower/better than the daily because positive and negative errors will cancel each other out a bit.
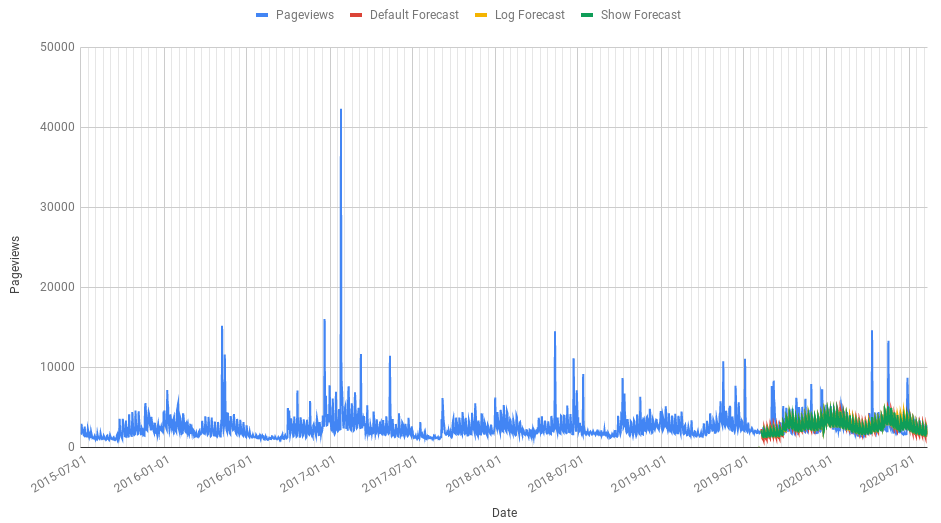
Example
In this Google Sheet you can see an example of four different forecasts, each of which tries to accurately predict the number of pageviews of the Graham Norton wikipedia page.
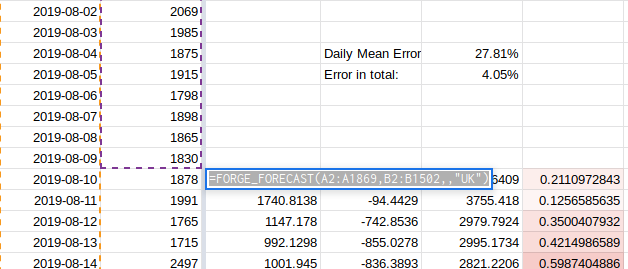
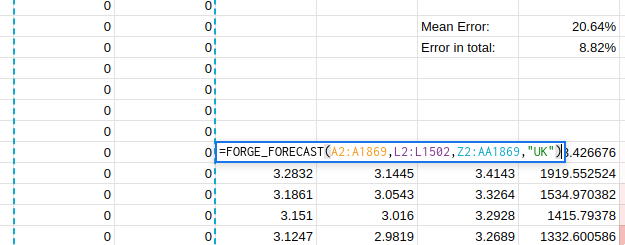
The first method (in cell C1503) we send the dates and the number of pageviews
to the forecasting algorithm and nothing else (no regressors). We also tell the
algorithm that using UK holiday dates might be useful; I’m assuming here that
most of the pageviews are from the UK.
We can see if using a different assumption about country holidays helps improve the forecast accuracy or not.
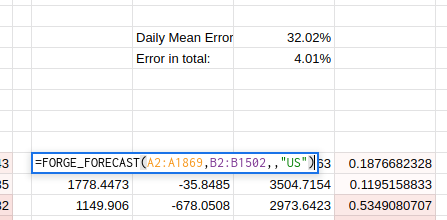
Changing the forecast to use US holidays improves the aggregate error very
slightly from 4.05% to 4.01% but the daily MAPE is worse at 32%. The formula for
this is in cell H1503
This trend continues as I try to find better regressors:
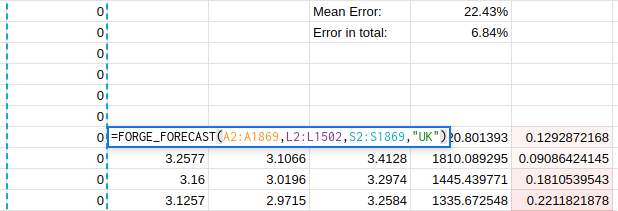
Unfortunately, it seems like there is no easy answer and that to properly optimise the forecast accuracy I will have to carefully consider the uses to which the forecast will be put.
Problems with this approach
In machine learning it is common to split your data in a “train” set and a “test” set. You configure and tweak the model using the training set and then evaluate the performance on data the model hasn’t seen before - the test set.
However, the act of repeatedly tweaking the model and re-evaluating on the test set can lead to the “winning” model only being the best by coincidence or because of some weird feature of the data that ends up in the test set.
To avoid this problem, and to get the best possible estimate of accuracy on unseen data ML practitioners can also create a “validation” set which can only be used once at the very end of the process to estimate the real world accuracy of the chosen method.
If we were to follow the train/test/validate method and we were looking to make a forecast for the coming year we would immediately lose two years of data to make the test and validation periods.
                    Train                  Test      Validate
  _____________________________________~~~~~~~~~~~~============
  |------------|------------|------------|------------|--------?????
2016         2017         2018         2019         2020
This isn’t a bit deal if you have years and years of good quality, clean data without any periods where collection or processing has gone a bit wrong.
But that would be the exception rather than the rule!
The other problem is that it means the model is being trained on a period of time that is further away from the place where it will have to make predictions. The only constant is change and it is definitely true that the forecasting methodology that worked best in 2018 is not necessarily the one that will work best in 2020 and beyond.
There isn’t an easy solution to this problem; just be aware that if you go down the backtesting and tweaking rabbit hole then the future accuracy of your forecast will probably be worse than the accuracy on the test set. And the more things you try when you’re tweaking the worse it might be.