Box-Cox Transforms
Yesterday I updated the addon to include two new data transformations:
- The Box-Cox transformation
- The Logit transformation
You can read a little introduction on transforming data and why this is useful in the Improving Forecasts tutorial.
But why specifically are these transformations useful and when should you use them?
You can read about the Logit transform in another tutorial. Right now, here is the Box-Cox transform.
Box-Cox Transformation
You can follow along with this example in this Google Sheet which uses the pageviews of the wikipedia Easter article.
Drawing a histogram of the daily pageviews looks like this:
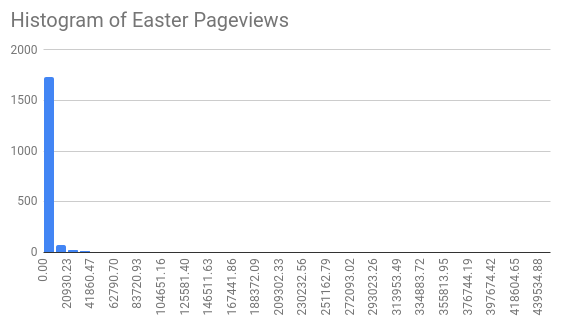
Almost all days have a small number of pageviews (the tall bar on the left) and then there are some that are way more popular (the invisibly small bars that extend to the right). This is common for highly seasonal data like this.
But this kind of data distribution can be hard to make predictions about; the range of data is too big. The idea of the Box-Cox transformation is to find a transformation where the end result is that the data looks more like it is normally distributed. A lot of machine learning algorithms work better on this kind of data because it is easier to reason about.
Finding Lambda
The Box-Cox transform has a variable that is usually called lambda; you have to find the value of lambda that makes your data look normally distributed.
Do this by visual inspection of the histogram.
Here is an example showing how to use the FORGE_BOXCOX function and the
resulting histogram for when lambda is zero.
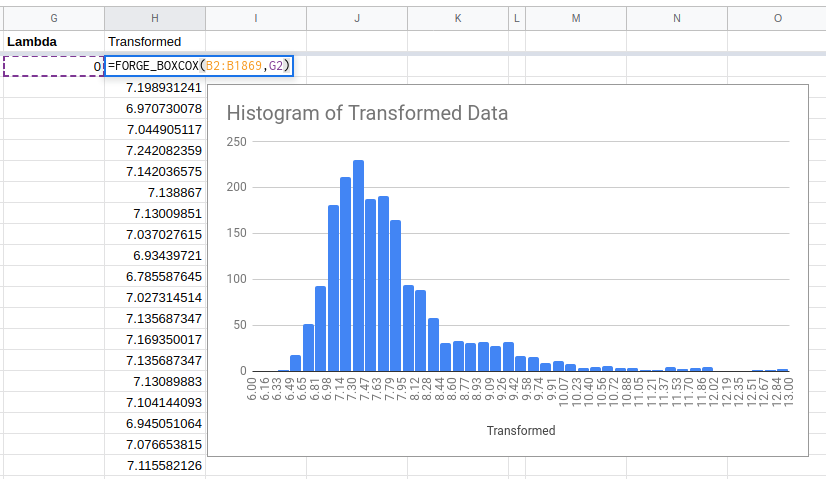
The first argument to the FORGE_BOXCOX function is the range of values you
want to transform (in this case B2:B1869).
The second is the value of lambda.
Looking at the resulting histogram we can see that it is way closer to a normal distribution than we were to start with. This is good!
This histogram shows a distribution with a tail going out to the right. Confusingly, this is known as a right skewed distribution even though the peak is to the left of where we would like it to be..
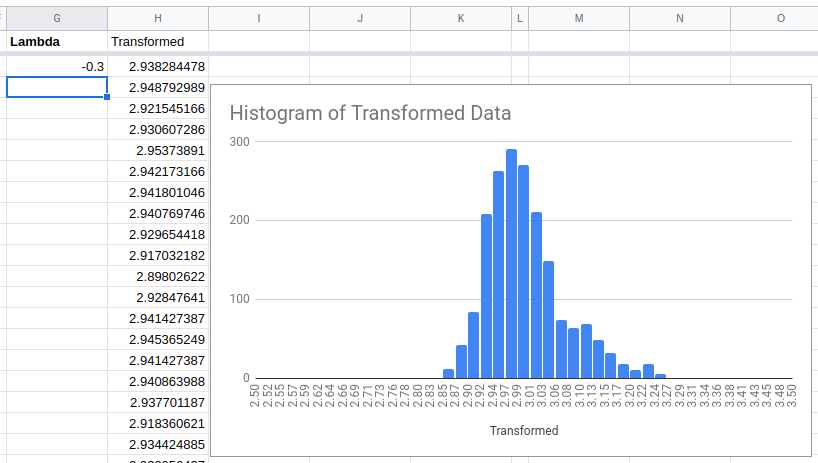
Because the distribution is right skewed we should try a lower value of lambda next.
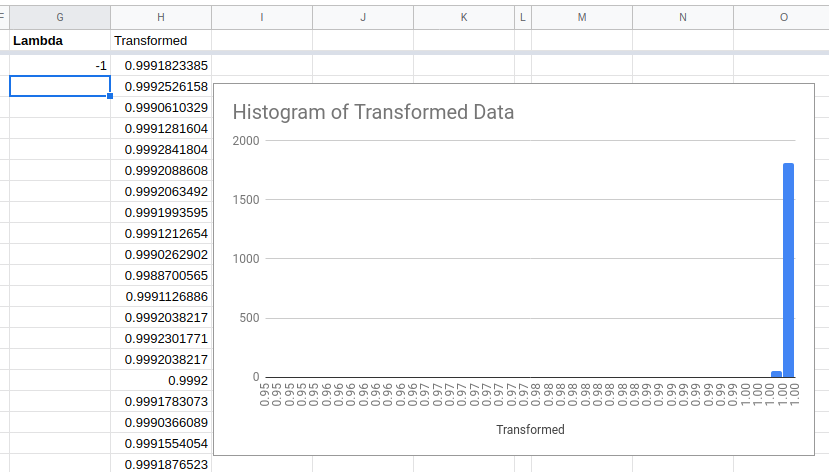
This is as bad as what we started with but in the other direction!
Try a value of lambda somewhere in the middle.
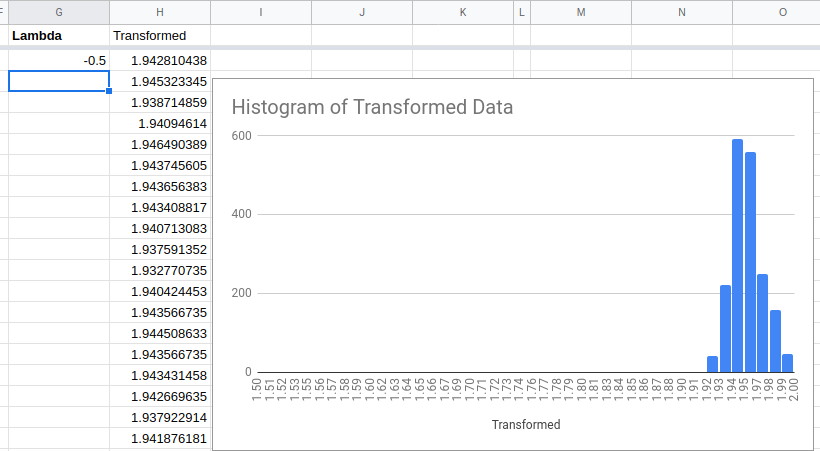
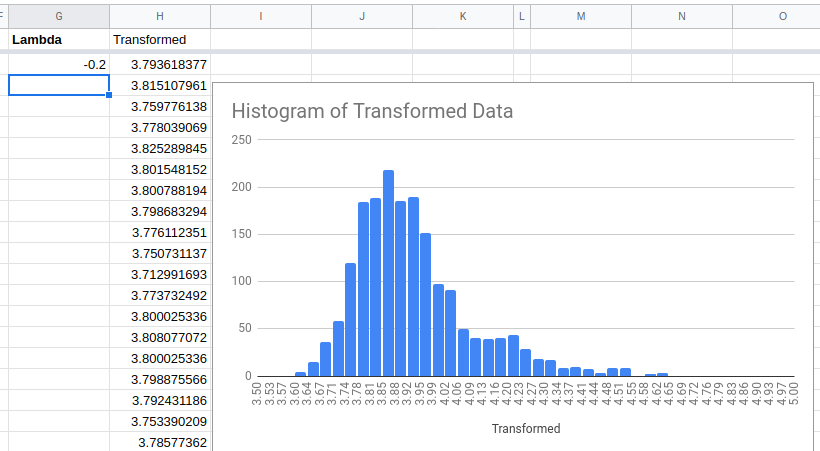
This is not perfect, but it is much better.
Let’s compare the forecasts:
First, make the forecast based on the transformed values. In the above example, I have also asked the forecast algorithm to use US holidays when making predictions.
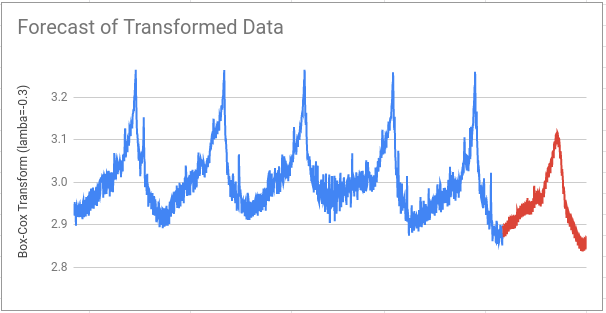
Then we need to do the inverse Box-Cox transformation because the forecast predictions are made on the transformed data. Applying the inverse transform turns the forecast output back into an estimate for the pageviews.
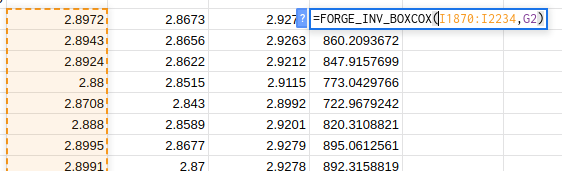
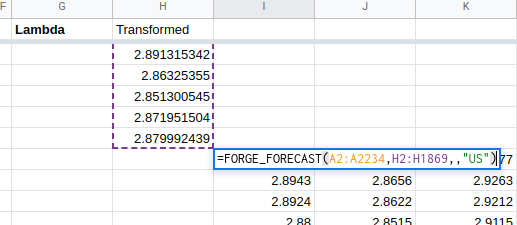
The FORGE_INV_BOXCOX function does the reverse transformation. The first
argument (I1870:I2234) is the range to be transformed. The second (G2) is
the value of lambda.
Remember! Use the same value of lambda in your inverse transform as you did in the original transform.
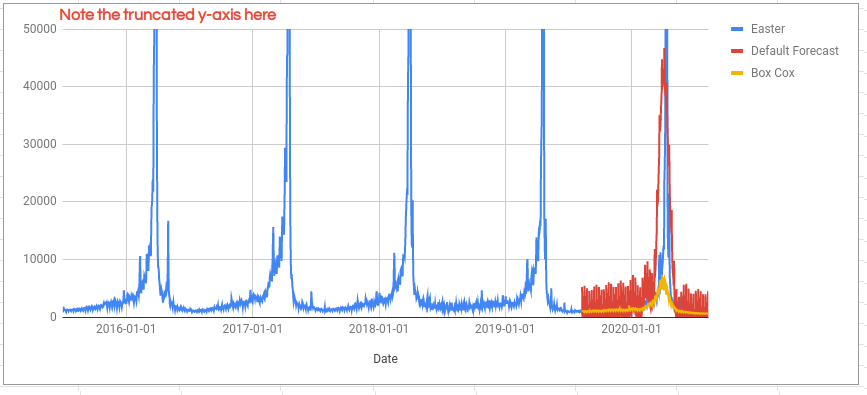
The forecast made from the Box-Cox transformed values (yellow line) looks like a much better fit for most of the year than the untransformed forecast (red line). However, it is a worse fit around the Easter period where both forecasts massively underestimate the levels of Easter traffic. For details on how to improve this part of the forecast see the regressors section in the tutorial.
Is the forecast actually better overall. We can calculate the Mean Absolute Percentage Error (MAPE) to find out:
- MAPE for the default forecast: 170%
- MAPE for the transformed forecast: 26.08%
Using the Box-Cox transform has significantly improved forecast accuracy!
You can further improve accuracy by adjusting the value of the lambda parameter; the rule about “pick the value that makes it look like a normal distribution” is really more of a guideline.

The best result I can find is to set lambda to -0.15 which results in a MAPE of 16.31%.
Be careful with parameter tuning like this; it can just mean you are overfitting results on your test set and that you will not see the same levels of performance on new data.