Forecasting the Effect of Lockdowns
A Covid-19 vaccination is now clearly visible on the horizon but there are still significant uncertainties about when exactly this will become available and what will happen in the meantime.
In the UK I think there is likely to be a period of national lockdown in January. And maybe more in the Spring too. Other countries in Europe are in a similar situation and who knows what will be going on in the USA by then?
It is important for businesses to be able to make good estimates for what their demand will look like at these times. I will show you how to do this in Forecast Forge.
1. Prepare your data
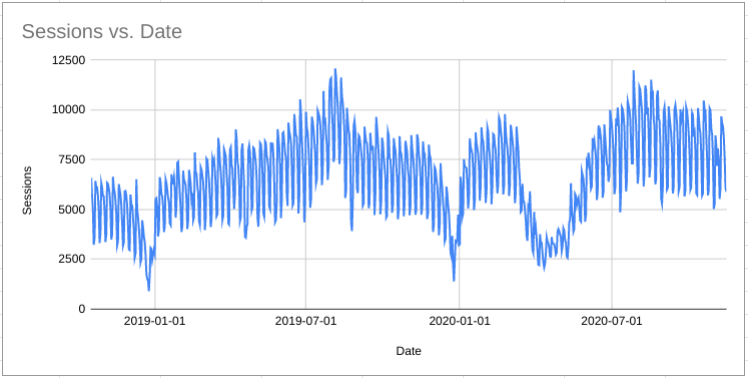
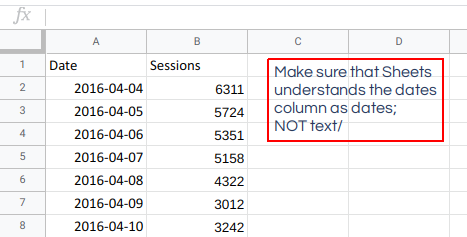
Export your sessions data from Google Analytics (or your tool of choice) into Google Sheets.
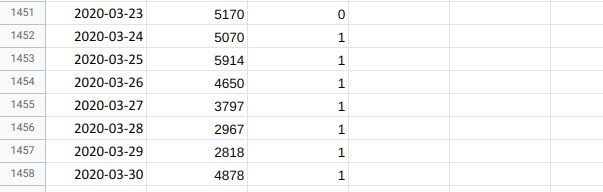
You need two columns of data; the date and the metric you want to forecast.
Forecast Forge needs at least two years of data to estimate annual seasonality; with less than this it is impossible to tell whether the dip between Christmas and New Year is a repeating pattern or just a random thing.
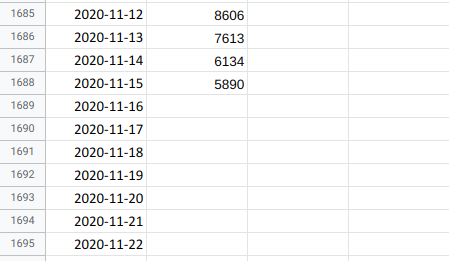
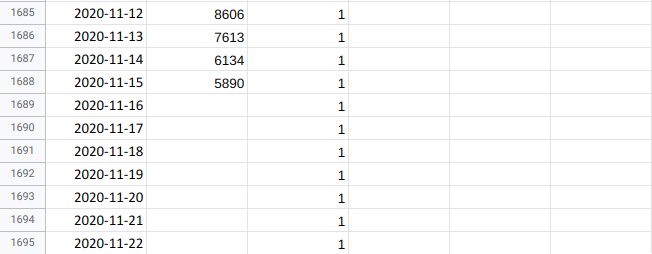
Extend the dates column out into the future; as far as you want to forecast. I’d suggest going at least as far as June 2021 for a lockdown forecast.
2. Add a lockdown helper column
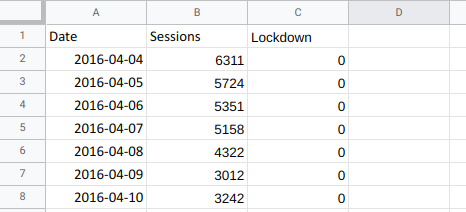
Next create a helper column which will tell the Forecast Forge algorithm when lockdowns have taken place. This is also where you can add different lockdown scenarios for the future.
The simplest way to do this is to use a “0” on all the days where there was no national lockdown and a “1” on the days when there was.
Your helper column must extend into the future too. It should have the same number of rows as your dates column.
3. Make a forecast
Activate the Forecast Forge addon in your current sheet if you haven’t already.
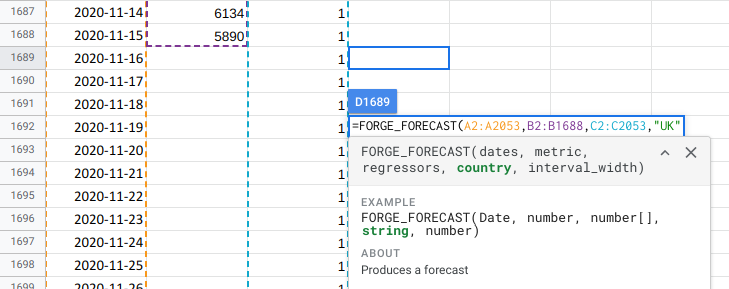
A reminder of the arguments in the FORGE_FORECAST function:
- A range containing the dates. This must cover the historical data and the days in the future you want to forecast
- A range containing the metric you want to forecast.
- A range containing the lockdown helper column you created in step 2.
- A country code. In this case “UK”
Forecast Forge will then make the forecast:
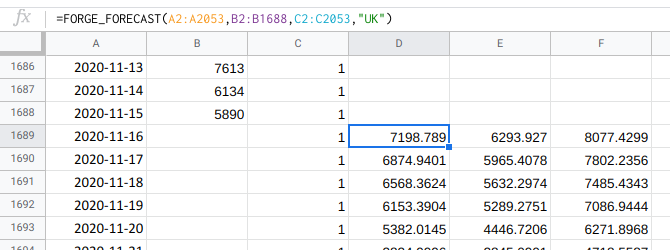
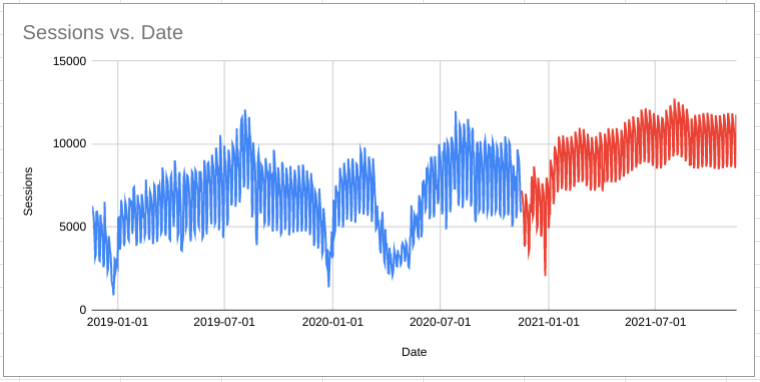
The above forecast shows a drop during the November lockdown, a recovery during December and then the usual lull over the Christmas period before business booms again in 2021.
4. Test other scenarios
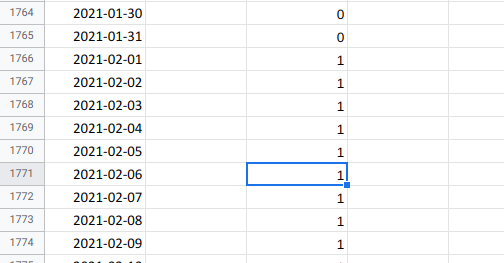
What if there was another lockdown in February?
To model this scenario you need to change all the zeroes in your lockdown helper column to be ones during February 2021.
The forecast will automatically update (this is the big advantage with using the custom function rather than the sidebar).
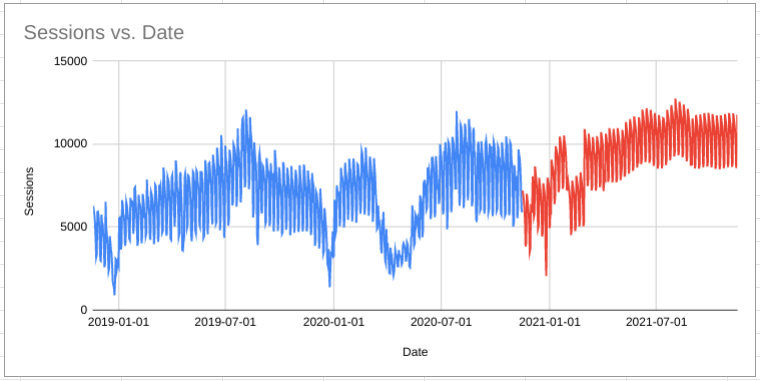
You can see the predicted impact on a February lockdown; it springs straight back up again afterwards.
5. More advanced ideas
There are lots more things you can do with this; I have only demonstrated the simplest method that works reasonably well. Try out some of the below ideas:
- Add extra helper columns for lockdown in Scotland, Wales etc.
- Add extra columns for when different regions are in tier 3 restrictions
- Use something more sophisticated than “0” and “1” for encoding lockdowns. For example, the current UK lockdown is less restrictive than the one we had in April/May. You could encode the first lockdown with a “1” and the current lockdown with “0.8”.
- Particularly with the early lockdowns the public often began to adjust their behavior before governments brought in lockdown rules. You often see metrics changing (for better and worse) before the official lockdown start date; you could model this with a more gradual change between 0 and 1 in the run up to the official start date.