Adding Weather Data to Forecasts
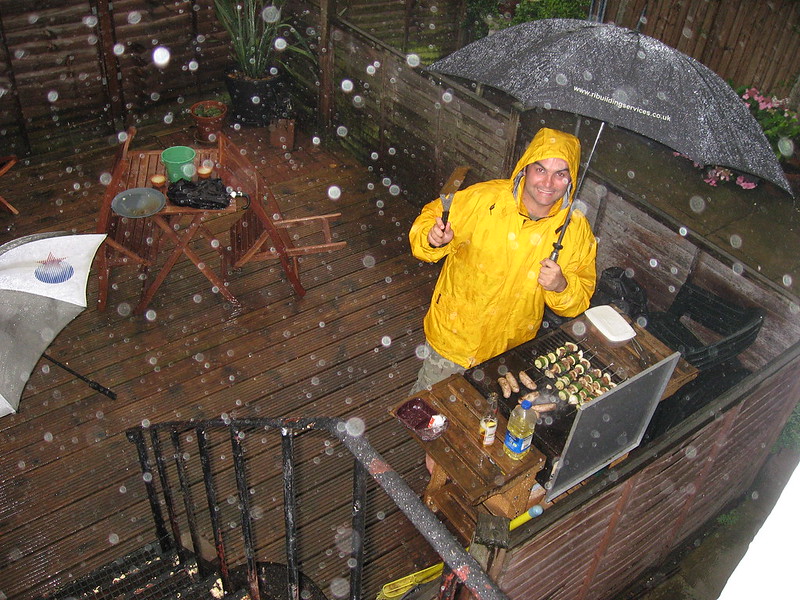
A lot of different types of business are influenced by the weather. Some ecommerce sites see an uptick during bad weather when more people are looking at their screens. Other businesses sell products that customers only start thinking about buying during certain weather conditions; this can range from barbecues at one end of the scale to hats and gloves at the other. You can probably think of a few other interesting examples from your own experience.
Adding historic weather data to your forecast can help quantify the link between weather conditions and business outcomes and it can also help make for a better forecast for the future. For example if you sell a lot of barbecues on the first hot weekend in May then, without the weather data, the forecasting algorithm can’t know what has caused this and will see a lot of random variation. This random variation is assumed to continue in the future so you will end up with:
- A forecast that does not take into account the weather forecast
- A forecast with a wider predictive interval than necessary
Weather data can be a very useful addition. Forecast Forge now provides some custom functions to help you include this in your forecasts.
The Data
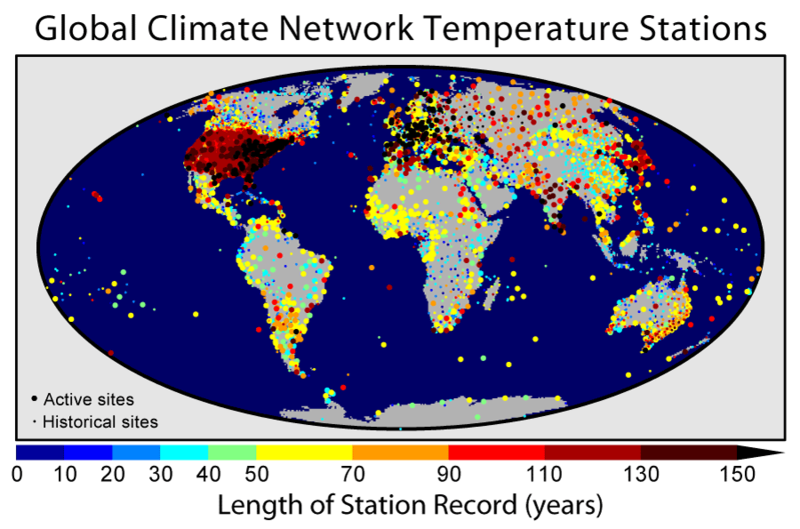
It is important to realise that weather conditions are very closely linked to a time and location. There is no such thing as “UK weather” because the weather can be very different at one end of the country compared to the other - and averaging out the two values might give you completely the wrong impression about what people are experiencing in the middle!
So weather data is collected at a particular location (known as a weather station) and then there is a small amount of processing done to turn it into a daily figure like, for example, maximum temperature or total precipitation. This is the kind of data you will need to work with in order to include weather data in your machine learning.
Forecast Forge’s weather data comes from the Global Historical Climatology Network (GHCN) which is a project from the National Oceanic and Atmospheric Administration (NOAA) to integrate and standardise this data from different weather stations around the world.
It is available for free directly from their website and in BigQuery which is the data source that Forecast Forge uses for this.
Different weather stations record different metrics (e.g. a station in the Sahara is unlikely to bother with snowfall!) so not everything you might want to use will be available everywhere.
The most common metrics are:
PRCP: Precipitation, measured in millimetersSNOW: Snowfall, measured in millimetersSNWD: Snow depth, measured in millimetersTMAX: Maximum temperature, measured in tenths of a degree Celsius (!!). i.e. a value of 200 corresponds to 20 degrees.TMIN: Minimum temperature, measured in tenths of a degree Celsius
You can read about other metric that some weather stations collect in the official data documentation (see Table 4 on page 5).
Custom Functions to Add Weather Data to Google Sheets
Forecast Forge includes two custom functions to help you add weather data to Google Sheets:
FORGE_WEATHER_STATIONSto help you find weather stations in, or close to, a particular area.FORGE_WEATHER_HISTORYto pull the historical weather data for those stations and put it into Google Sheets
I’ll show you some examples of this in a moment, but to summarise your process for adding weather data should look like this:
- Find appropriate weather stations that measure the thing you are interested and have data over the time period you are interested in too
- Get the data from these weather stations and deal with any missing values (probably by interpolation)
- Backtest a forecast using this data to see whether or not it improves things
And, finally, you will have to forecast the weather yourself in order to estimate what will happen in the future. If weather is important, it is best to present several scenarios with this rather than a single option; for example, “this is what it will look like with a hot April”, or “if we have a wet June then sales will be down X% compared to last year”. If you just want a single “best guess” scenario based on the average weather the Forecast Forge will estimate this without you having to include specific weather data.
FORGE_WEATHER_STATIONS
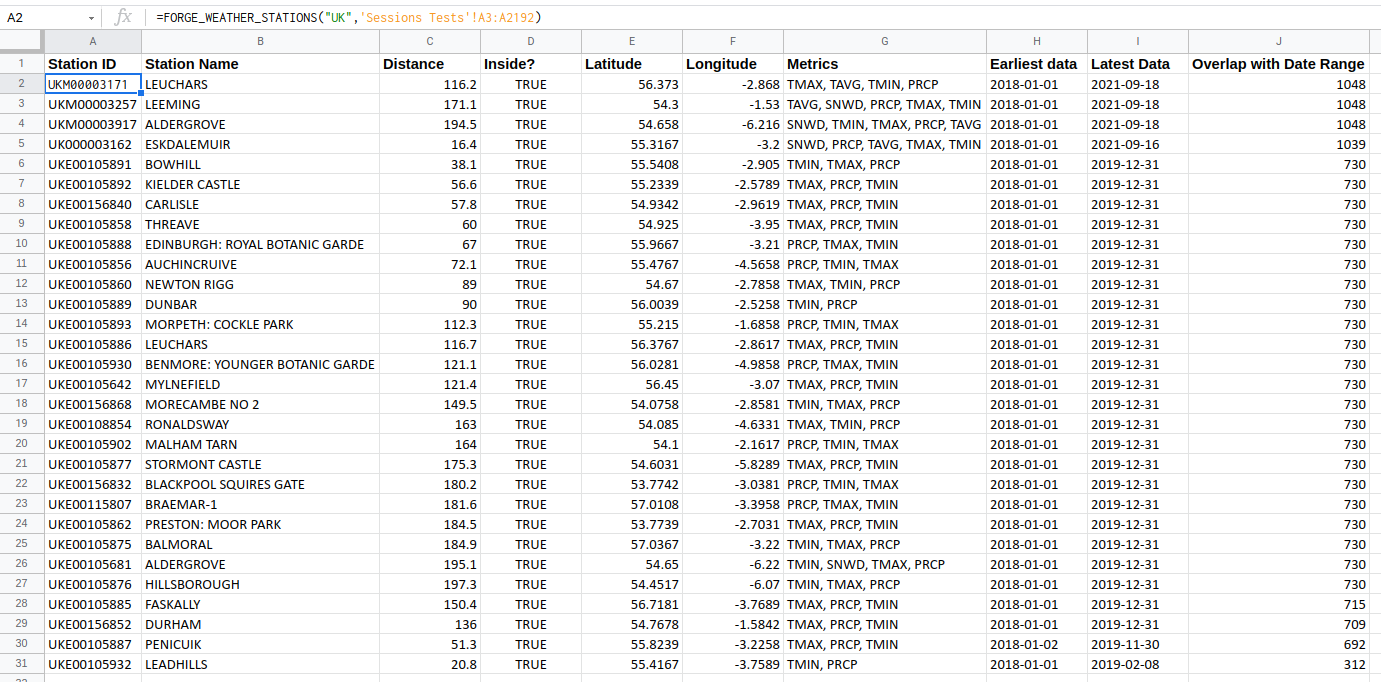
FORGE_WEATHER_STATIONS takes two arguments:
- A string describing the location of interest. For example “UK” or “Houston, Texas”
- A list of dates - this is used to see if the data from a weather station overlaps with the period of time you are interested in.
The function will return data for up to 100 weather stations. The ten columns of returned data are:
Station ID: A unique identifier for the weather station. You will need this to request weather data for a specific station when usingFORGE_WEATHER_HISTORY.Station Name: The name of the weather stationDistance: How far the weather station is (in kilometers) from the point at the center of the location you entered.Inside?: ATRUEorFALSEvalue saying whether the weather station location is inside the location of interest. For example, is the weather station actually inside a city or is it just close to it.LatitudeandLongitude: The location of the stationMetrics: The different weather metrics recorded at this stationEarliest DataandLatest Data: The dates at which the weather station started recording and the date of the most recent data from this stationOverlap with Date Range: How many days out of your date range does the weather station have data? Sometimes the earliest and latest data doesn’t tell you everything because there can be missing data in the middle.
Once you have a list of appropriate weather stations, the next step is to
pull the data using FORGE_WEATHER_HISTORY
FORGE_WEATHER_HISTORY
FORGE_WEATHER_HISTORY takes three arguments:
- A list of dates for which you want the weather data
- A list of weather stations - data from multiple weather stations is averaged in the final result
- A list of weather metrics
The first argument should be a vertical column; i.e. one row per date. The second can either be a string (or a reference to a single cell) if you only want data from one weather station or another vertical column.
The final argument, the list of metrics, can either be a comma separates
list (e.g. "PRCP,TMIN,TMAX") or a reference to a
horizontal range (e.g. B2:D2).
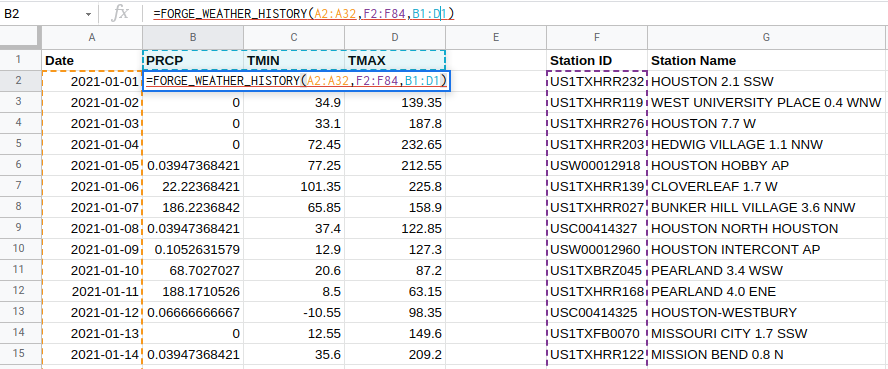
The above example gets precipitation, minimum temperature and maximum temperature for weather stations near Houston in early January 2021.
Remember that the units for meterology data are often a bit odd (e.g. tenths of a degree) so you might need to convert them to something more normal before sharing them with a stakeholder. Purely from a forecasting perspective, this doesn’t matter because the Forecast Forge algorithm does some scaling of regressor variables which means that any linear transformation of the data (e.g. multiplying it by a constant and/or adding a constant) will give the same result.
A Note on Data Quality
Weather station data can have all kinds of problems because of faulty sensors. There is some processing done by the NOAA to remove data that is likely to be wrong but there is no guarantee that they will have found every anomaly. You will often also find days missing data.
You must check your data to make sure it is good enough quality. Plot it over time and look carefully for missing days.