Forecasting for Paid Media
PPC and Google Ads is where I first started in my career so it has a special place in my heart. I have a million ideas on how forecasting and Forecast Forge can help in this industry and they are all logjammed up in my head waiting for me to write “The Ultimate Guide to PPC Forecasting” or something like that.
You could say I’m having some supply chain issues with keeping the blog posts flowing so I thought I’d just get something out there with some of my thoughts even if it isn’t everything.
Using Daily Spend as a Regressor Column
When thinking about which factors inflience paid channels one of the most important and most obvious ones is the amount of money you spend! Spend more money, get more clicks/conversions/revenue etc. How much more is an important question which I’ll get to later.
Without data on how much was spent any machine learning algorithm will struggle to tell the difference between changes in budget and other factors (e.g. seasonality, growth in the market etc.). Was June a big month because conversion rates are higher in June or is it just that the budget was a lot higher?
In Forecast Forge you need to specify the values for any regressor columns into the future in order to make a forecast. This is easier with paid media budgets than it is with something like the weather because people generally have a budget plan for the year ahead which can be a good starting point.
Transform the Data
You can think of a very simple model of paid media performance as being something like this:
output = media spend * other stuff
outputis whatever metric you are interested in; normally revenue, conversions or clicksmedia spendis the amount of money you spentother stuffis everything else from cost per clicks to conversion rates and the seasonalities in all these thingsmedia spendandother stuffare multiplied together because if either one of them is zero thenoutputneeds to be zero
One of the good things about machine learning is that we can give is a vague
model like this and it can fill in a lot of the details for us. The big idea
here is that you can train the Forecast Forge algorithm on historical output
and media spend data so that it will learn all the important patterns in the
other stuff.
Unfortunately there is one further complication; Forecast Forge uses an additive model which looks something like this:
output = trend + seasonality + regressors
But our model of paid media is multiplicative so we’ll have to do a data transformation first. The log transformation will convert a multiplicative model into an additive model because
ln(media spend * other stuff) = ln(media spend) + ln(other stuff)
(ln is the logarithm function)
So to make our original paid media model fit with how Forecast Forge works it looks like this:
ln(output) = ln(media spend) + ln(other stuff)
You need to train the model on the log of output with the log of media spend
as a regressor column. This will give you a forecast for ln(output) which you
can then exp to transform it back into a forecast for output.
With this transformed model we are asking Forecast Forge to learn the trends and
seasonalities in ln(other stuff) rather than just other stuff. In practice,
this normally works fine.
Diminishing Returns
The original model has one flaw; a 10% increase in media spend will always
lead to a 10% increase in output. There are no diminishing returns.
Although this is a really nice model simplification it misses a crucial and important part of what it is like to manage paid media; as you increase the amount you spend then the ROI on each marginal dollar gets lower and so your overall ROI gets worse too. If this wasn’t the case and you could spend the 1001st dollar with better ROI than the 1000th dollar then you should do whatever you were going to do with that dollar earlier!
Similar to the earlier, simple model we want to come up with a vague “shape” for what these dimimishing returns look like and then the machine learning can fill in the details more precisely.
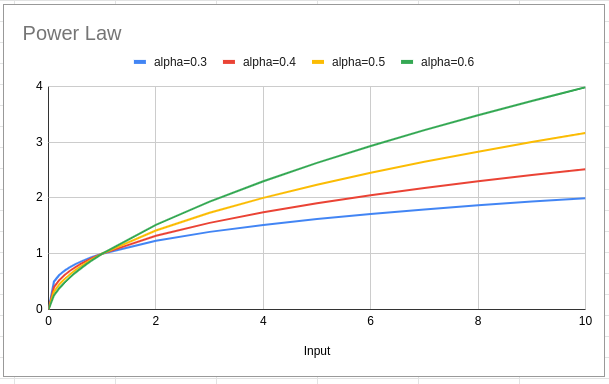
One nice option for the shape of the diminishing returns curve is a power law:
output = (media spend)^alpha
When alpha is less than 1 this gives a curve where the return diminishes
over time. Different values of alpha change how hard the output is hit by
diminishing returns as media spend increases.
So the new model is
ln(output) = ln(media spend^alpha) + ln(other stuff)
But, luckily for us (!!) ln(x^a) = a*ln(x) this simplifies to
ln(output) = alpha * ln(media spend) + ln(other stuff)
The regression part of the Forecast Forge algorithm is designed to figure out
the value of alpha in this case so you don’t need to do anything extra (beyond
the log transformation) to get power law diminishing returns in your forecast!
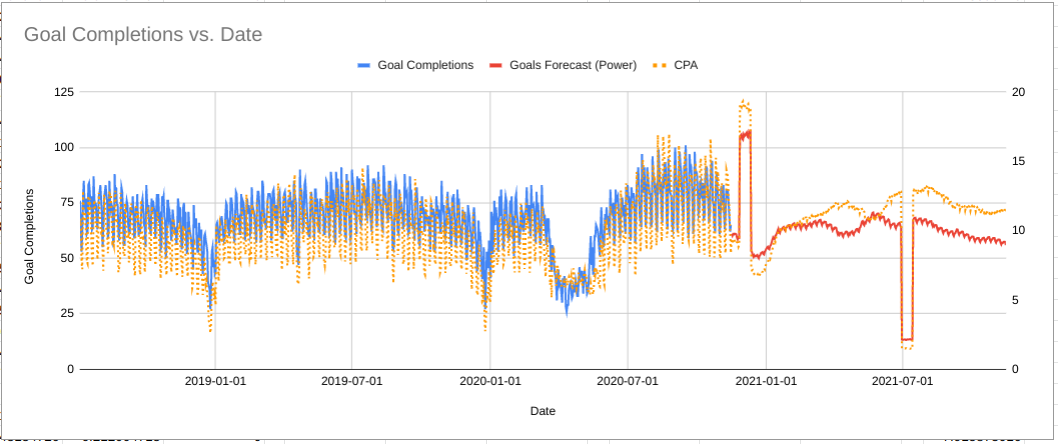
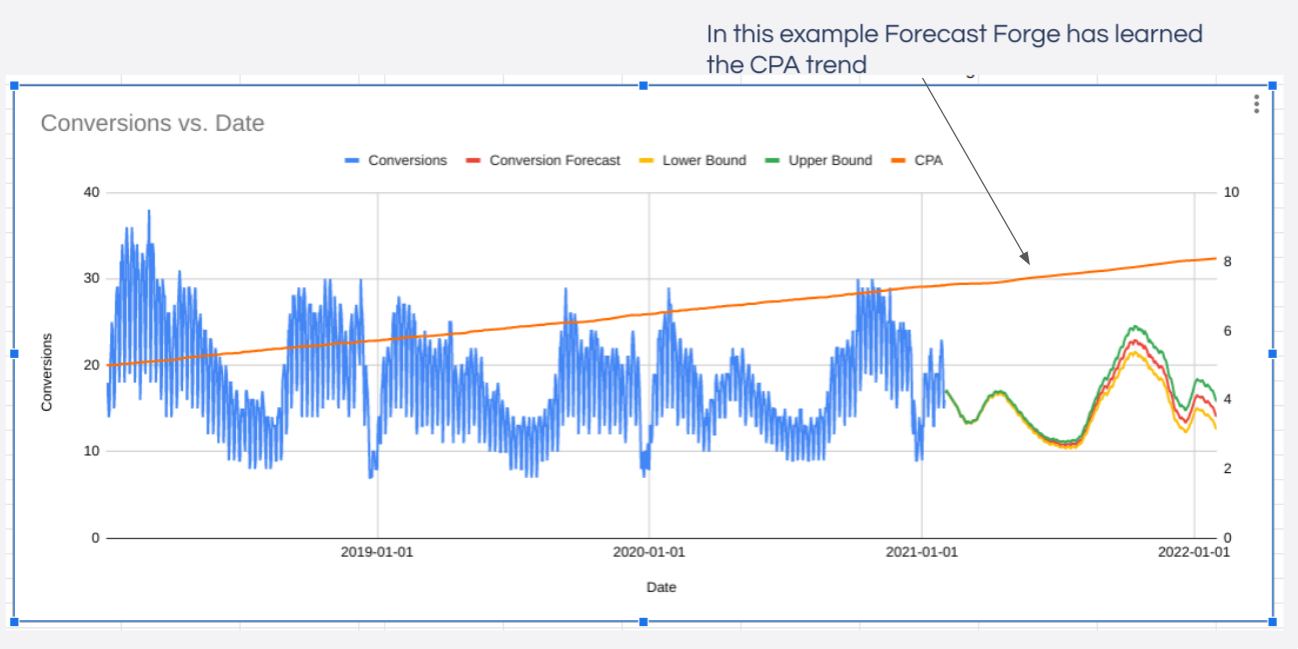
In the above example massively increasing the budget in late 2020 is forecast to increase the number of goal complete but the CPA is also forecast to increase massively at the same time; this is because the machine learning is modelling the diminishing returns of increased media spend.
Situations where this won’t work
Unfortunately there are a couple of weaknesses to this method that means it shouldn’t be used in every situation:
- The model assumes the value of
alphais constant over time. In real life changes in paid media auctions (e.g. competitors ramping up their spend, Google changing their rules) means the diminishing returns curve will not be the same all the time. - The machine learning algorithm must have sufficiently varied data to be able
to learn the value of
alpha. For an extreme example; if the media spend is exactly the same every day then then there isn’t really anything the algorithm can learn from it; it works much better if some days the spend has been unusually low and there are other periods where spend has been increased. [And ideally these changes in spend should arise from manual intervention rather than just following the seasonality up and down] - The model assumes that limitless growth is possible; there might be diminishing returns but, as long as you keep increasing the media spend, the output can continue growing without limit.
I’ll address the final situation in the next section. If you are struggling with the first one then get in touch and I’ll see if I can help. For the second problem (lack of training data) there are no easy solutions.
Capacity Limits
If you are a small ecommerce business just dipping your toes into the Google Shopping waters then you won’t need to worry about hitting the limits of the available market for some time; in this situation the power law model above is likely to be “good enough” for some years.
But if you are a large advertiser or someone trying to figure out the right amount to spend on brand then you really do need to worry about what the upper limits are and how close you are to them; assuming unbounded growth is not realistic and ignores an important part of the problem for you.
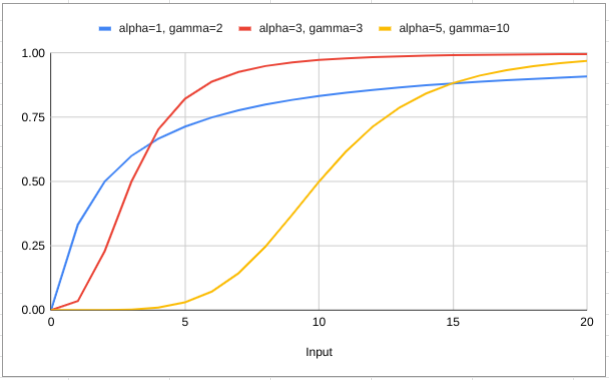
To account for this, we need to change the model from a power law to something more complicated. The team over at Facebook Marketing Science use the following shape in Robyn:

- The coefficient
cis the capacity or maximum possible value for the output that it is possible to get. - In our context,
xis themedia spendvariable - Then there are two parameters
alphaandgammawhich control the shape of the curve.
Our new model looks like this (after doing the log transform):
ln(output) = ln(capacity * spend^alpha/(spend^alpha + gamma^alpha)) + ln(other stuff)
Remember that taking logs turns multiplication into addition so this is actually
ln(output) = ln(spend^alpha/(spend^alpha + gamma^alpha)) + ln(capacity) + ln(other stuff)
Which means that we can group capacity in with other stuff and leave it for
the machine learning to figure out rather than having to worry about it
ourselves. Sometimes I love algebra!
This still leaves the alpha and gamma parameters. I’m sad to say that I
don’t have a nice easy way to figure these out in Forecast Forge (yet!). I
suggest running backtests with different values to see what gives you the best
fit on historical data.
When your spend is equal to gamma you should be at 50% of the total capacity
(e.g. 50% impression share) which might give you a good starting point for the
trial and improvement process.
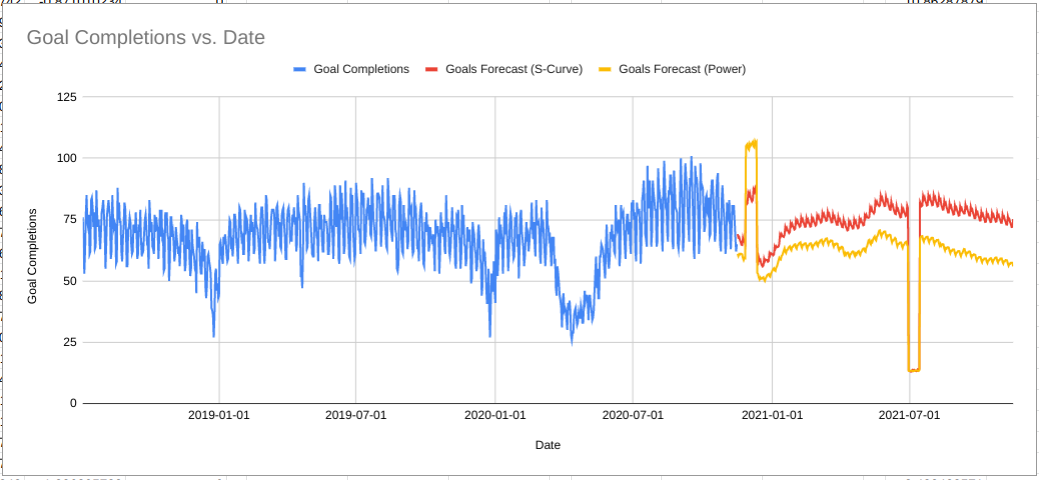
The chart above shows the same data as before comparing the power law and S-curve (saturating) forecasts. As you can see, the algorithm has learned there is lower capacity in Q4 so even with a massive increase in budget the number of goal completions is capped and much lower than what the power law forecast predicted.
This is much more realistic for this business; there is no amount of money they can spend in December that will get them more goal completions than they had in August.
More to come on these topics in future blog posts; subscribe by email to make sure you don’t miss out (I only send blog updates to this email list - no sales pitches beyond whatever appears on the blog anyways).