All I Want for Christmas Review
On November 9th 2021 I made a forecast for the number of pageviews of the wikipedia page for Mariah Carey’s song “All I Want for Christmas is You”.
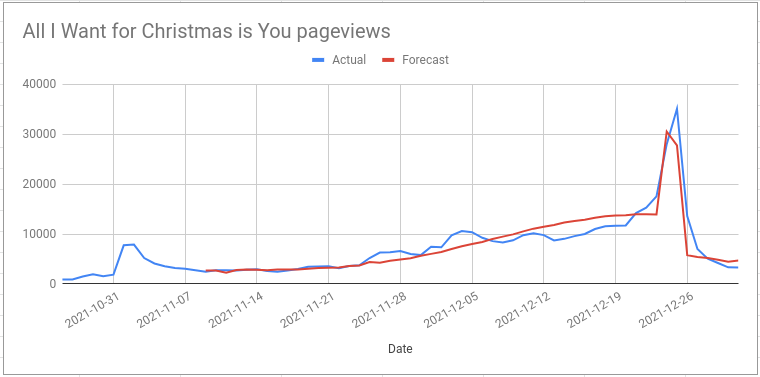
Now that Christmas is over I can compare my forecast with what actually happened:
I also made a more specific prediction:
pageviews for the “All I Want For Christmas is You” wikipedia page will peak on 24th December close to 30k
I was right about the number of pageviews on Christmas Eve (28k actual value) but I was wrong about when the peak would be. The true peak was on Christmas day with 35k pageviews.
The average percentage error across all the days was 14.4% and the overall
error on total pageviews was 0.6%; some days are an overestimate and some days
are an underestimate and over the course of the forecast these two things cancel
out to give a better error on the total than you’d expect on the average day.
Overall I am quite pleased with how this turned out. The “sawtooth” method was simple to implement and worked quite well with the default Forecast Forge forecasting model. As with many things in forecasting and data science, that hard part is figuring out that this is an approach worth trying; once you’ve done that bit the actual “doing” part is fairly easy.
How could I have done better?
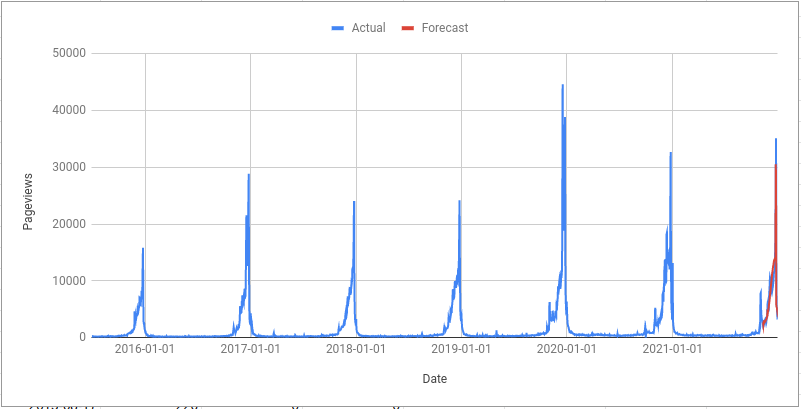
Evaluating what I could have done differently will always run the risk of overfitting to the most recent data. It is slightly more helpful to look at the whole timeseries and see if there are any patterns I’ve missed:
There were two parts to my prediction:
- The size of the peak
- The day on which it occured
I can’t figure out what I could have done better to predict the size of the
peak. Averaging the peak value for 2019 and 2020 would give a prediction of
35777 which is much closer to the actual value of 35094 than my guess of
30546.
But this makes the assumption that 2019 and 2020 are the start of a new trend where the wikipedia page is a lot more popular at Christmas than it was in 2015-2018. Would this assumption be resonable when I only had two data points to judge it?
Now, with an extra year, it does seem a lot safer to assume that Christmas 2022 will look more like 2019, 2020 and 2021 than 2015-2018 but back in November I think saying “2019 and 2020 were odd years; 2021 might be a bit like them but there is also a chance it will return to the pattern seen 2015-2018”. This reasoning was never made explicit in my prediction but the algorithm is doing something similar behind the scenes.
I could have done much better on my prediction of when the peak would occur. Here is a list of the peak days from 2015 to 2020:
- 2015: 25th December
- 2016: 25th December
- 2017: 25th December
- 2018: 25th December
- 2019: 24th December
- 2020: 25th December
- 2021 prediction: 24th December 😐
I should have done this 5 minute analysis before making my prediction. And then, when I saw that the model was predicting a peak on the 24th I should have thought “that doesn’t seem right” and investigated what might have been going wrong.
Looking at the 80% predictive interval shows that 19 out of 53 values are
outside of the range. This is 36% and it should be 20% for a well calibrated
forecast.
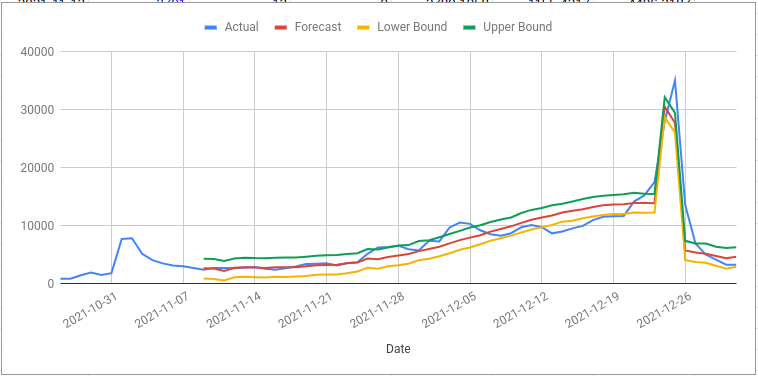
Ignoring the days after Christmas day (where I didn’t really care very much
anyway) also gives 36% so it seems likely that the forecast predictive
interval is too narrow. This means the model has underestimated the amount of
randomness in the data; normally I see the opposite problem where the predictive
interval is too wide.