Post-Bank Holiday Update
This last week has been all about usability.
I have tried to improve the error messages so that when the inputs are bad or something else goes wrong you have a better idea of what it is and how to fix it.
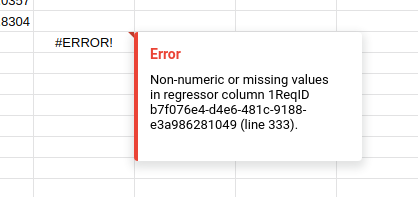
There is still a lot of work to be done here but these improved messages will hopefully help people use the tool; an important part of learning is making mistakes and experimenting but this doesn’t work if you can’t get good feedback - if you are just guessing and hoping for the best it will take a lot longer to learn.
The request ID is included so people can send this to me if they really get stuck. I can then follow this ID through the server logs to see where things went wrong.
The other big change has been in the addon sidebar.
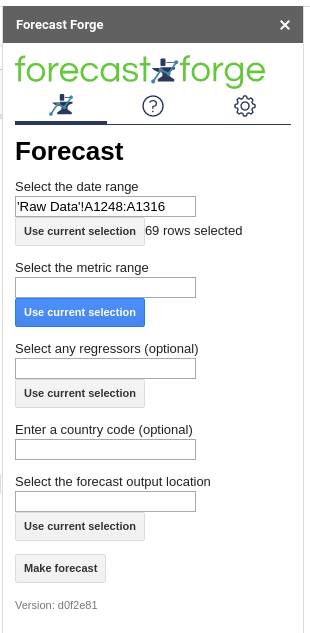
Behind the scenes how this works has been completely changed. I’ve rewritten most of it using a client side framework which, at the expense of a few extra tenths of a second in loading time, gives a much more responsive sidebar.
You can also create forecasts from within the sidebar. Right now the output works in exactly the same way as the custom function except, because it is not a custom function, the output won’t automatically update when the input range is changed.
In my opinion this is strictly worse than using the FORGE_FORECAST custom
function but generating the forecast through the sidebar will enable the
following:
- Removes the 30 seconds timeout that restricts custom functions. This will allow running more/better/different forecasting algorithms
- The sidebar provides a better interface for advanced forecast configuration
- There is a lot more flexibility about how/where the output is displayed. A custom function must output in the rows below and the columns to the right of the cell where it is called. The sidebar can display results in the sidebar and at any other location in the spreadsheet.
The combination of these three things will (eventually!) allow you to use the sidebar to do something like this:
- Select input data as you can currently
- This is sent to the server (same as what happens now)
- If there is enough data (at least 3x the length of the forecast period; i.e. you need at least 3 months of data for a 1 month forecast) then the server can backtest different forecasting algorithms and data transforms to see which performs best on your data.
- The forecast produced by the best methodology will displayed in the spreadsheet
- The sidebar will show estimates for the forecast accuracy as well as the results from all the other forecasting methods. You will be able to see how these look in the spreadsheet by selecting them from the sidebar.
- This “Forecast Metadata” can be saved somewhere in the spreadsheet so you can refer back to it later.
I nearly had some of this ready to launch today but then I realised that the data sent to the server might already have been transformed. Calculating accuracy on the transformed data does not give the same result as calculating it on the untransformed data so returning accuracy estimates in this way won’t give the correct result.
The solution is to try various transforms on the server side. This will lose you a bit of flexibility in how you can transform the data before it gets to the forecasting algorithm; I will add an “advanced configuration” option so that people can say they don’t want to transform the data on the server.