Estimating ROI during pre-sales with Ian Daniels and reallymoving.com
The forecasting was such a key part of getting that buy in. Turning it around in three days with the level of detail we did wouldn't have been possible without Forecast Forge.
—Ian Daniels
About Ian
Ian Daniels is a director at a UK customer experience and digital agency. A lot of their work is with the Adobe experience cloud and they are experts at the implementation and itegration of these products.
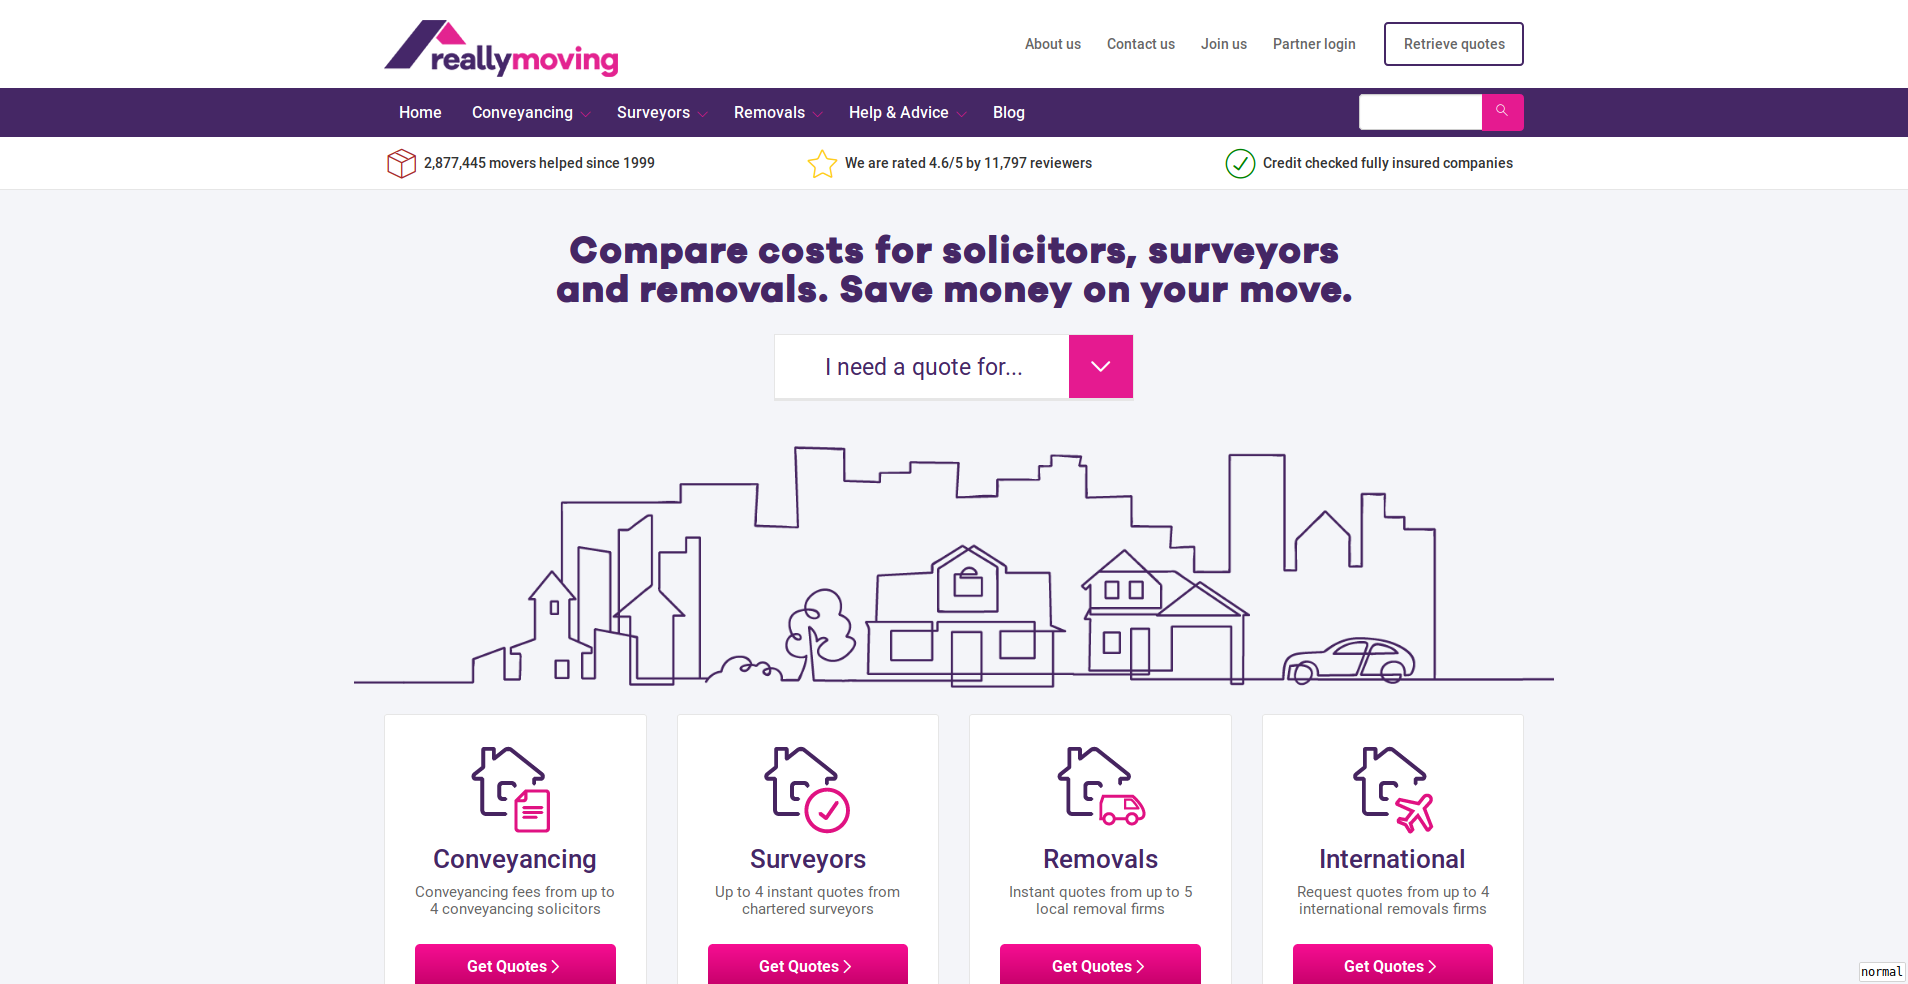
In November 2020 they were in discussions with reallymoving, a comparison site and aggregator for home moving services (e.g. solicitors, surveyors etc.). Because of Ian's large amount of experience in this area he knew that reallymoving could expect at least a 13% uplift in revenue from the type of analytics investment he was proposing.
But in order to help reallymoving understand the ROI of this investment he needed to know what the baseline scenario, without any uplift, was. There had been significant changes in demand (in both directions!) for reallymoving's services during 2020 because of lockdowns so being able to plan what this might look like in 2021 was very important for understanding what the ROI would look like.
Clients want to know their return on investment, particularly if they're going to be putting large chunks of cash into enterprise technology. And Forecast Forge is a really quick way to help them figure out what that might look like.
And, as an extra complication Adobe were offering reallymoving a significant discount but this offer was extremely time limited; the deal would have to be completed before the end of Adobe's financial year.
The Forecast
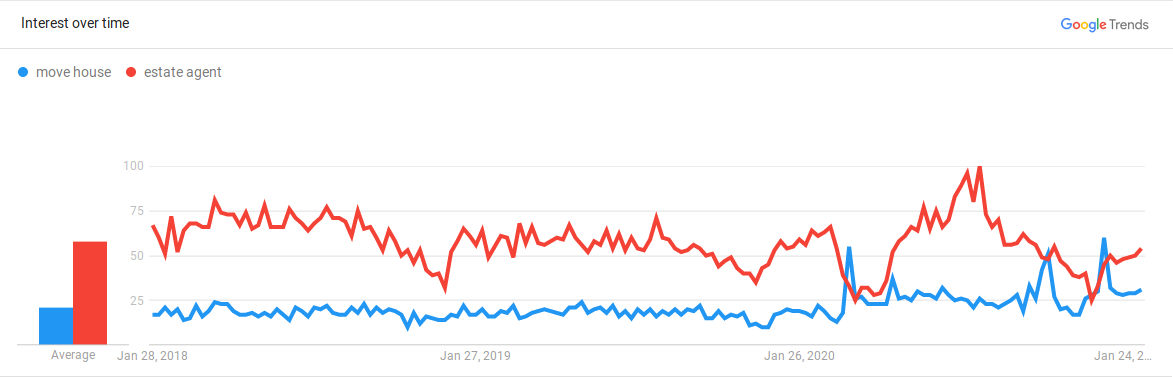
In the UK, covid has had two main effects on house moves:
- A reduction in demand during lockdowns when it is harder for people to view houses.
- An increase in demand outside of lockdowns caused by a reduction in tax (the "stamp duty holiday").
Ian's challenge was to quickly present forecasts for a variety of lockdown and stamp duty scenarios so that reallymoving could make an informed choice about their analytics investment.
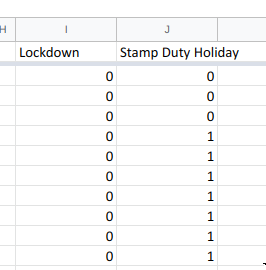
Ian used two regressor columns; one to show when lockdowns were happening and one for the duration of the stamp duty holiday. In both cases he knew when these had occured in the past and could present different scenarios by editing the values for the future.
For example, he could explore the impact of another lockdown starting in January or the stamp duty holiday being extended into the Summer.
[This was written during the lockdown but before the stamp duty holiday was extended]
The Results
Ian was able to put together a board pack containing the forecasts and the business case for the new analytics investment (which would pay for itself within the first year). reallymoving decided to really move forward with their analytics implementation.
Within three days we were able to help them put together a board pack and a business case that modelled the uplift.
Using Forecast Forge to make the forecast also freed up enough data science time for some awesome work on other projects.
He spent his time building a coverage API integration into Ad Cloud so that they can change their their bids by the coverage that they have in postcode regions [...] He was able to create something super valuable to the business because we were provinding the forecasts with Forecast Forge.
It was quite a collaborative process. Having the forecasts available in a shared spreadsheet so everyone could be more involved and add data in if they wanted to was really important for transparancy and building up trust.
Next Steps
The original forecast was "top down" in that is looked only at overall numbers. One possible improvement is to make separate forecasts for each marketing channel and then aggregate them together into an overall forecast.
And of course, once you've made a forecast and shown it to the board the next step is always to try to beat it!