Custom Functions for Growth Trends
If you already know what this is about and why you might want to use it then skip the motivation and go straight to the Documentation. Otherwise, read on…
Motivation
A good place to start with Forecast Forge is to make a baseline forecast. You can think of this as a “this is what we think will happen if things keep going as they are” prediction.
Then, if you’ve setup the right regressor columns, you can start to make predictions for the future based on different regressor scenarios; for example:
- What if we grow our email list by 30%
- What if we reduced our media spend during May?
- What if the covid rules change again?
But there are some cases where you can’t use this approach. All machine learning forecasts need historical training data that it can use to make estimates about what will happen in the future. If you are going to do something that you’ve never done before then, by definition, there is no training data so machine learning won’t help very much!
This is very common when agencies are asked to forecast growth for new clients; the agency pitch is going to be “we will do something for you that either you haven’t done before or we’ll do it in a different and better way” so there is no training data for this.
[The ML approach here is to use data from other new clients as the training data under the assumption that performance for client A will be similar to clients B through Z. How well this works will depend on how similar the clients are. I might discuss this method some other time; it isn’t easy to do well in Forecast Forge]
The usual approach, particularly for an SEO forecast, is to do an analysis of the client website and how strong the competition is then use this to predict the total amount of growth that is expected for a client. For example, a quick audit might spot a few opportunities on a client sites which combined with an analysis of the relative strength of their and their competitor’s link profiles causes an SEO to say “I think that we can grow traffic here by 25% in a year”.
You can layer this estimate on top of a Forecast Forge forecast by multiplying
every forecasted value by 1.25:
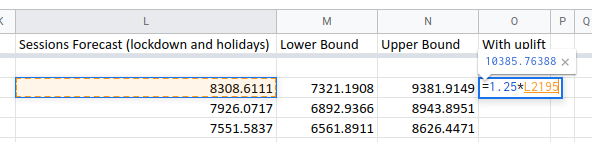
The big problem with this approach is that it assumes that all the uplift will happen from day 1. Immediately on starting the client engagement there will be a 25% increase in key metrics; this is unrealistic and, worse, it can lead to poor target setting if the the target is set as 25% higher than the previous year.
In reality month 12 might be 25% higher than the baseline forecast but it is very unlikely that month 1 will be (and if it is, can it be the new agency that has caused the change?).
The amount of uplift will grow over time, e.g. 0% in month 1, 5% in month 2, 8% in month 3 etc. etc. all the way to 25% in month 12.
Forecast Forge has three custom functions to help you spread an uplift over time.
Documentation
FORGE_LINEAR_GROWTH
Basically draws a straight line between a start value and an end value.
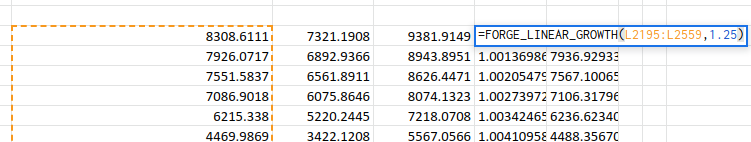
Takes three arguments:
- A range which has the same length as you want the output to be. E.g. if you are forecasting for 365 days then this range should be 365 rows
- An end value. The value you want in the last row
- (Optional) A start value. Defaults to 1
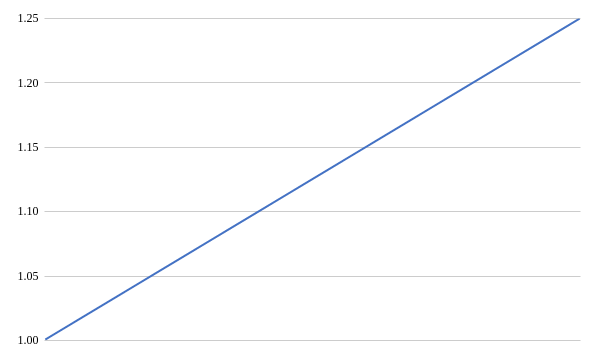
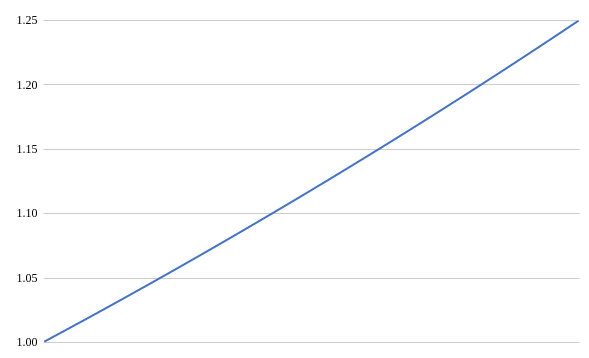
Here is what the output values look like plotted on a chart:
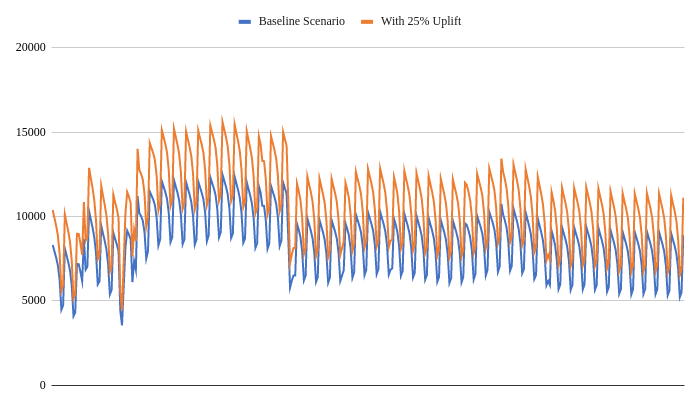
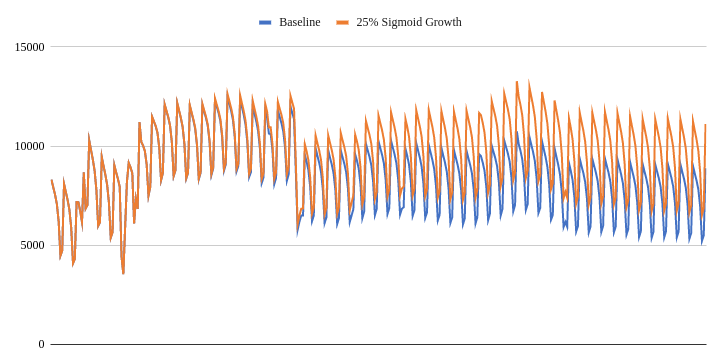
And here is what it looks like when you multiply a baseline forecast by the uplift values:
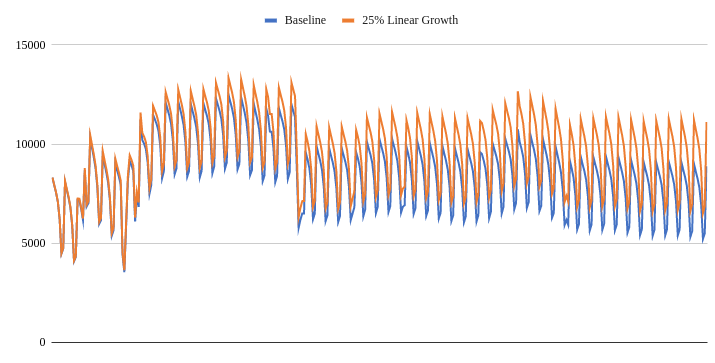
Notice how the two lines are very close together to start with and then slowly move apart from each other through the year.
Use this one when you expect immediate but slow and steady progress.
FORGE_EXPONENTIAL_GROWTH
1% better every day is 3778% improvement after 365 days.
This function takes your growth target (e.g. 25%) and splits it down into the same amount of percentage growth each day. E.g. to grow 25% after 365 days you need to grow 0.06% every day.
It takes the same three arguments as FORGE_LINEAR_GROWTH:
- A range which has the same length as you want the output to be. E.g. if you are forecasting for 365 days then this range should be 365 rows
- An end value. The value you want in the last row
- (Optional) A start value. Defaults to 1
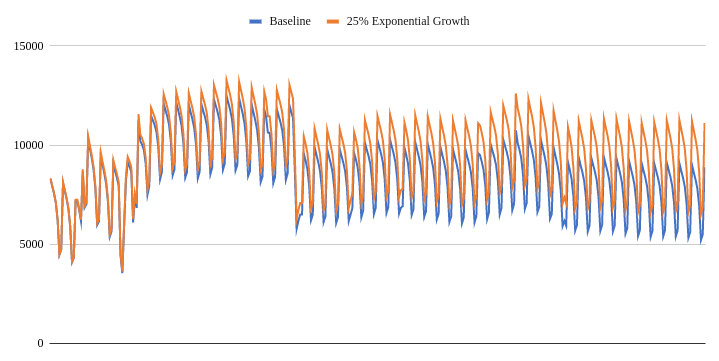
For small growth values the output is very similar to FORGE_LINEAR_GROWTH but
for larger end values you will see slow growth to start with and then
increasingly rapid growth at the end.
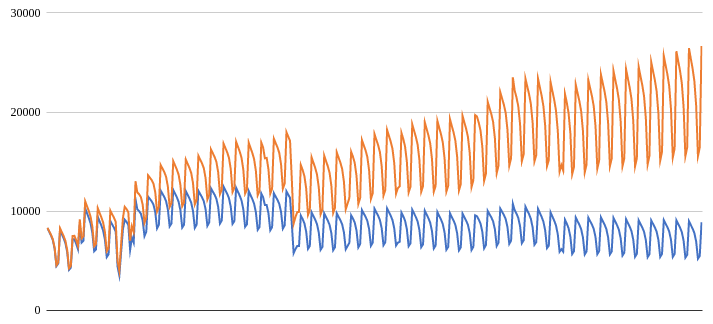
In the above example, they finish the year +200% compared to the year before. But after 1 month the growth is less than 10%.
Use this one if you feel confident that a slow start will be offset by rapid growth later on e.g. if there is some kind of “flywheel effect” or virtuous cycle going on when early gains act as a force multiplier for gains later in the year.
FORGE_SIGMOID_GROWTH
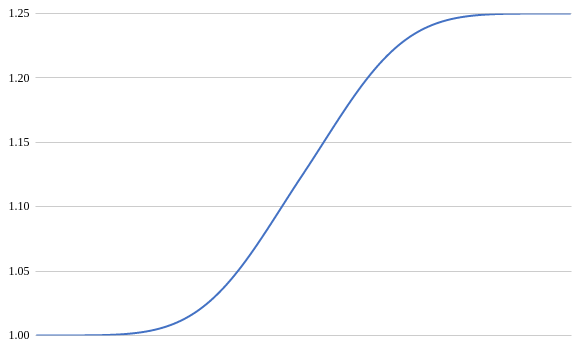
A sigmoid is an S-shaped curve characterised by slow (or no) growth to start with, a period of rapid change in the middle, and then another phase of slow growth at the end.
This function takes four arguments:
- A range which has the same length as you want the output to be. E.g. if you are forecasting for 365 days then this range should be 365 rows
- An end value. The value you want in the last row
- (Optional) A start value. Defaults to 1
- (Optional) A shape value which determines how steeply the curve rises in the middle. Defaults to 5
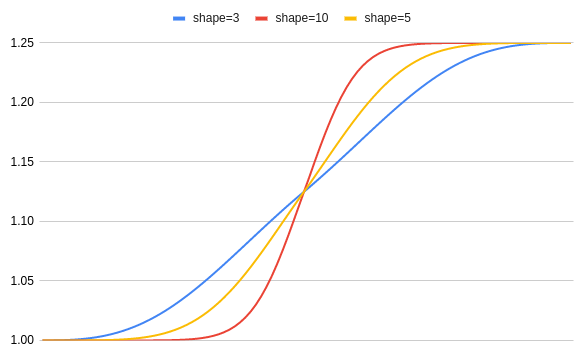
Higher values for shape give a quicker change in the middle.
In the above example, the adjusted values start off almost the same as the baseline forecast. Then there is a period of growth after which things settle down to being stable again at a higher level.
Advanced
You also have the full flexibility of the spreadsheet to combine these ideas in different ways or with your own methods.
For example, you could use four different FORGE_SIGMOID_GROWTH functions to
cover the growth you expect to see each quarter. Or start off with slow linear
growth that changes to exponential after 8 months. Or layer different sigmoid
functions together with each representing the growth you expect from different
keyword groups.
There are a lot of possibilities here. As with everything to do with Forecast Forge, I urge you to take the time to think carefully about how these ideas can be applied to your specific use case.