Creating your First Forecast
If you haven’t installed and configured the addon yet then you should read the Installation and Setup tutorial first.
Watch the Video
Or read about it in more detail below:
Getting the data
The algorithms which power the FORGE_FORECAST custom function
work across a wide range of metrics. But, for your first forecast, it is
helpful to have a concrete example of something.
I will show you how to forecast the number of pageviews for the wikipedia page for Easter.
You can download the daily pageview data as a CSV from Wikimedia pageviews dataset on ToolForge.
Or make a copy of this Google Sheet which contains the same data (up to the date of writing).
Plotting the data
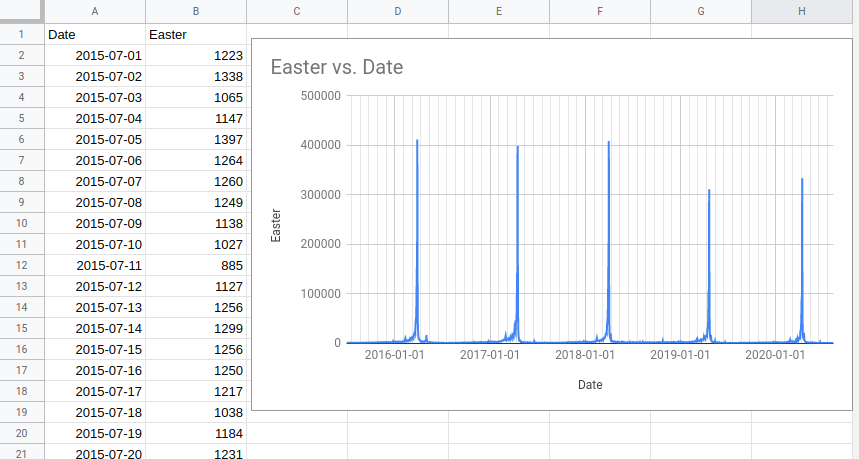
Once you have the data setup in Google Sheets you should have two columns:
- The date (in column A)
- The number of pageviews (in column B)
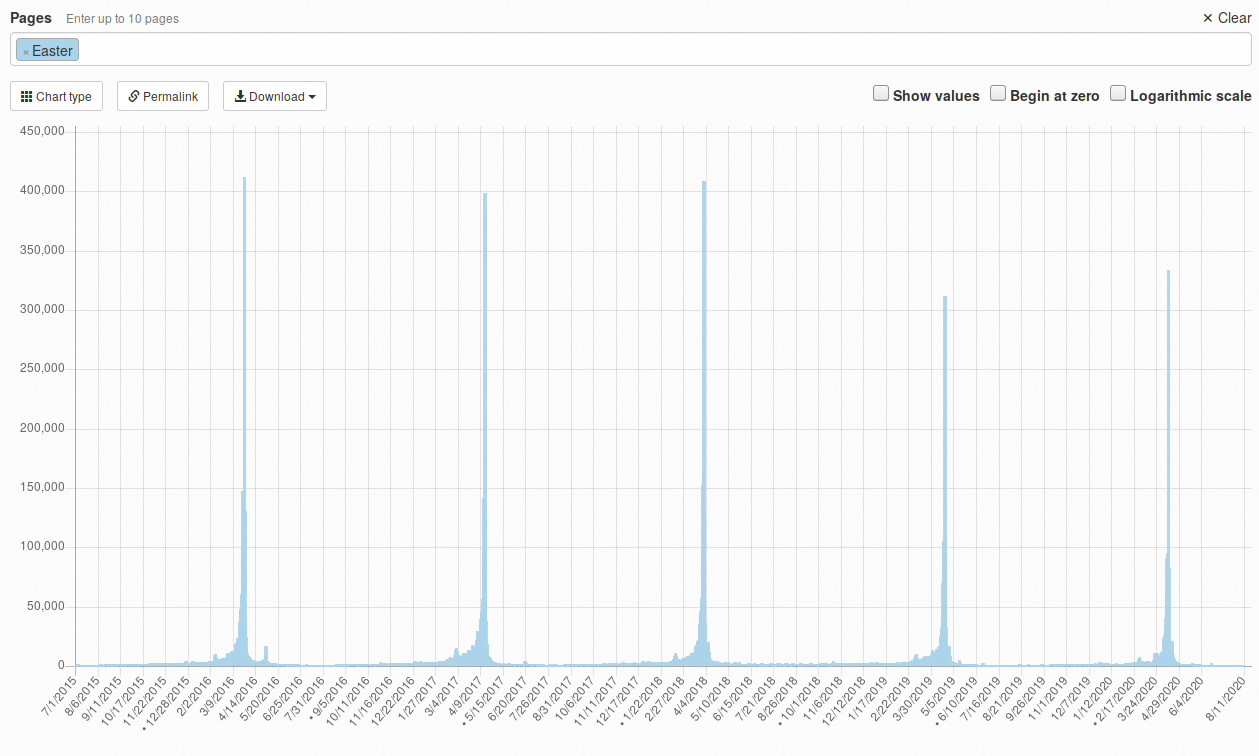
With forecasting, or any data science task, it is always worth plotting the data first so that you can check nothing is missing or if there is anything too crazy going on.
Here you can see the spikes in pageviews that occur every Easter. This is interesting for forecasting because although Easter happens every year it doesn’t happen at the same time every year.
Preparing to Forecast
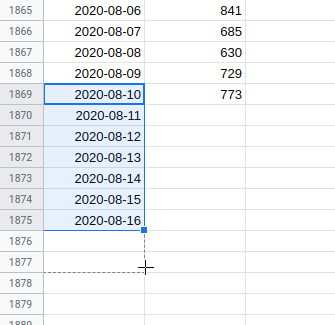
Scroll down to the last row of data in the spreadsheet.
Depending on how you imported the data into Google Sheets or whether you are using the starting template, you might have to add more rows at the bottom.
To make a forecast for the year ahead, add 365 extra rows.
Then extend the Dates column down so that the last date is one year in the future.
The FORGE_FORECAST function uses the difference in length between the Dates column
and the pageviews column to know how many days into the future to forecast.
Using the Custom Function
First, activate the Forecast Forge addon in the current sheet if you haven’t already.
You can do this by clicking “Activate” in the Forecast Forge dropdown in the Add-ons menu.
Now you are ready to use the FORGE_FORECAST custom function.
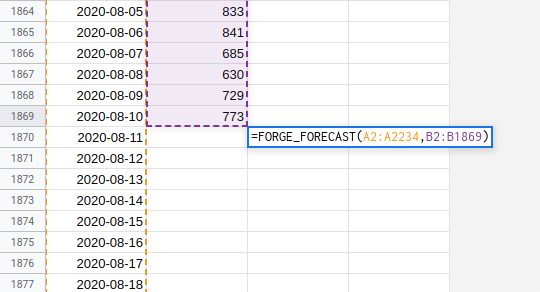
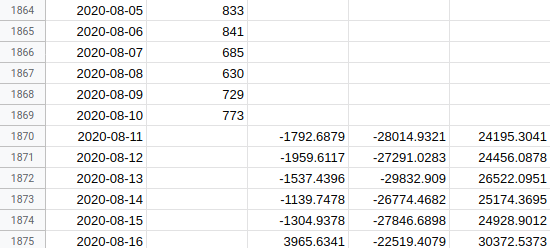
You want to insert the function into the first row without any pageview data (i.e. the row for tomorrow) in the third column. In the Easter template sheet this is cell C1870.
In the template sheet the formula you need is:
=FORGE_FORECAST(A2:A2234,B2:B1869)
The first argument (A2:A2234) is the dates; remember that this extends
into the future.
The second argument (B2:B1869) is the historical values for the thing
you want to forecast. This does not extend into the future!
You might need to change these ranges if you aren’t using the template sheet.
See the results
There will be a short delay and the cell will display “Loading…” while the data is sent to the Forecast Forge server and the machine learning algorithm is trained.
After it has finished you will see three new columns of data.
The first is the forecasted value. The other two are the lower and upper bounds of the 80% predictive interval. If the forecasting model is correct then 80% of the true values should be between these two numbers.
Congratulations! You have made your first Forecast Forge forecast!
Improving the forecast
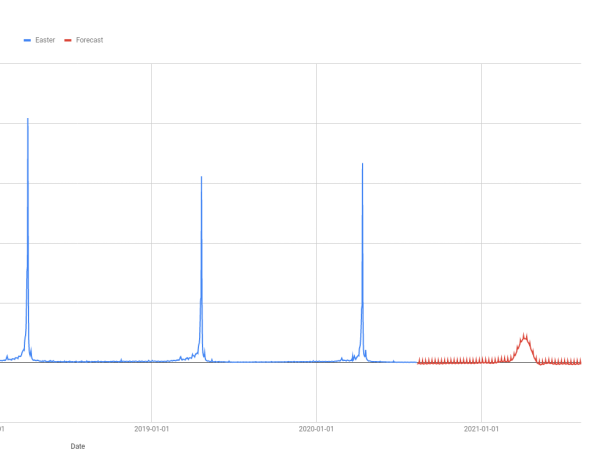
Looking at the above numbers and the plot to the left there are a couple of things that are obviously wrong with this forecast:
- The number of pageviews can never be a negative number.
- The chart shows a much smaller spike around Easter than in any previous year.
There is a little bit of an art to making a good forecast. The next tutorial in this series will show you how to improve your first forecast.