Improving Forecasts
This tutorial follows on from the Your First Forecast resource. If you haven’t completed that yet, you can make a copy of this Google Sheet to use as a starting point.
Forecasting problems
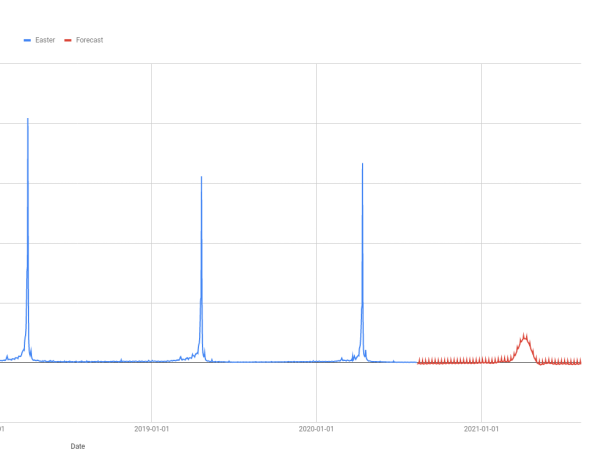
At the end of the last tutorial we had made a forecast for the daily number of pageviews for the Easter page on wikipedia.
There are two main problems with this forecast:
- Sometimes the values are negative and pageviews can never be a negative number.
- The number of pageviews on Easter Sunday is much lower than it has been in previous years.
The two methods I will teach you to help solve these problems are:
Data Transformations
 Without Data Transform

  ┌──────────────────┐
  │       Data       │
  └──────────────────┘
    │
    │
    ▼
  ┌──────────────────┐
  │ Machine Learning │
  └──────────────────┘
    │
    │
    ▼
  ┌──────────────────┐
  │     Forecast     │
  └──────────────────┘
With Data Transform

┌───────────────────┐
│       Data        │
└───────────────────┘
  │
  │
  ▼
┌───────────────────┐
│     Transform     │
└───────────────────┘
  │
  │
  ▼
┌───────────────────┐
│ Machine Learning  │
└───────────────────┘
  │
  │
  ▼
┌───────────────────┐
│ Inverse transform │
└───────────────────┘
  │
  │
  ▼
┌───────────────────┐
│     Forecast      │
└───────────────────┘
The idea here is that you do some kind of transformation of the data before it reaches the forecasting algorithm. Then the forecast produced by the algorithm predicts what the transformed values will be in the future. You need to do the inverse transformation to get the correct predictions at the end.
A simple example might make this clearer. Suppose you perform the transformation
+5 on every data point before you send the data to the forecast algorithm.
Then the predictions from the algorithm will be higher than what they would be if
the algorithm was trained on the original data. You need to perform the inverse
transformation, in this case -5, to turn the forecast output into a
good prediction.
How do you choose a transform?
Any invertable function you care to choose could be used as a transformation. But there are some commonly used transformations and one of these will be helpful in most cases.
| Transformation | Description |
|---|---|
| Logarithmic | Take the logarithm of the data. The inverse is exponentiating.
For example, in Google Sheets LOG10(B2) does the transformation
and 10^(C2) is the inverse. |
| Square Root | Take the square root of the data. The inverse is squaring. For example,
SQRT(B2) does the transformation and C2^2 is the
inverse. |
| Box-Cox | This is a more general transform for which the above are special cases. You can use
it through the FORGE_BOXCOX and FORGE_INV_BOXCOX functions
which are part of the addon. |
| Logit | The above transforms “squash” down from the top. The logit squeezes from both
sides. Another difference is that the results are bounded above and below.
This is very useful if you have a fixed range which you know the forecasted values
must lie in; for example, a conversion rate must be between 0% and 100%. You can use
this transform with the FORGE_LOGIT and FORGE_INV_LOGIT
functions. |
The idea is to pick a transform where the algorithm can make better predictions on the transformed data than it can on the raw data.
For example, machine learning algorithms generally are not good at dealing with data with outliers; this is what happens every Easter with our pageview dataset. A logarithmic transform will “squash” the outliers in more than the rest of the data so the size of the outliers will be smaller. This helps the algorithm make better predictions.
In this case, another advantage of a logarithmic transform is that the inverse transform (exponentiation) always outputs a positive value. This means we will never predict a negative pageview count again.
Performing a transformation
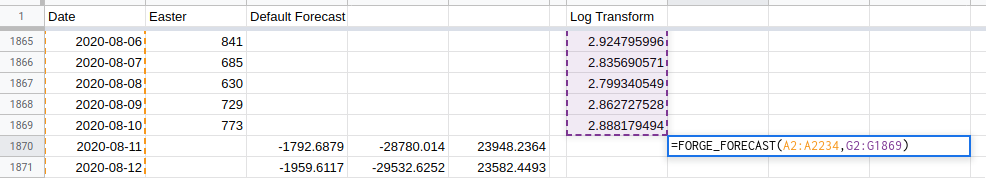
Start by making sure you have enough columns in the spreadsheet. You will need at least 11 columns (up to column K) to fit all the steps in.
Use the LOG10 function to populate a new column with the log transformed data.
As always, it is worth plotting the transformed data to see what the transformation has done.
There are still big spikes around Easter Sunday but these are much less outlying than in the untransformed data that we started with.
This will make it easier for the machine learning algorithm to learn the historical trends which is uses to make predictions for the future.
Forecasting from the transformed data
Use the FORGE_FORECAST function in a similar way to last time. Keep the
Date column the same, but change the other column to be the transformed data.
In this example the formula is:
=FORGE_FORECAST(A2:A2234,G2:G1869)
because column G is where the transformed data is.
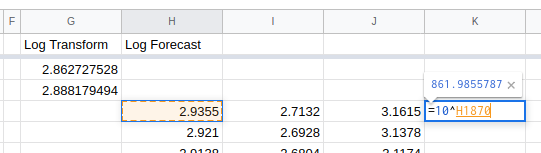
Remember that you need to run the inverse transform on the forecast output in order to make your pageview predictions.
Do this with the 10^ function.
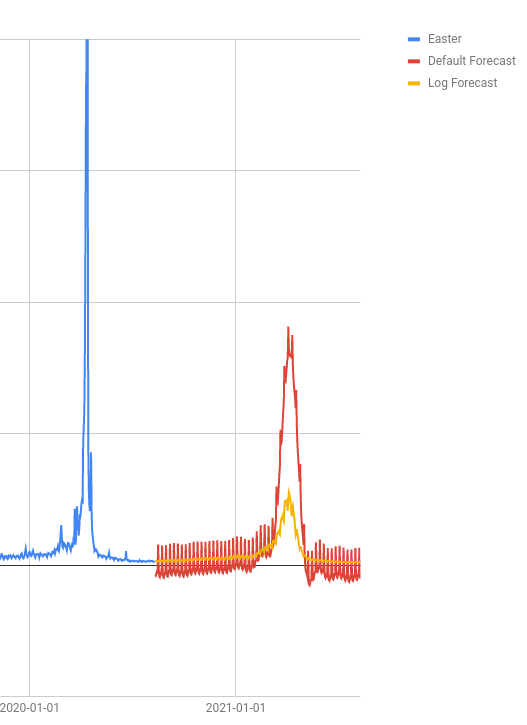
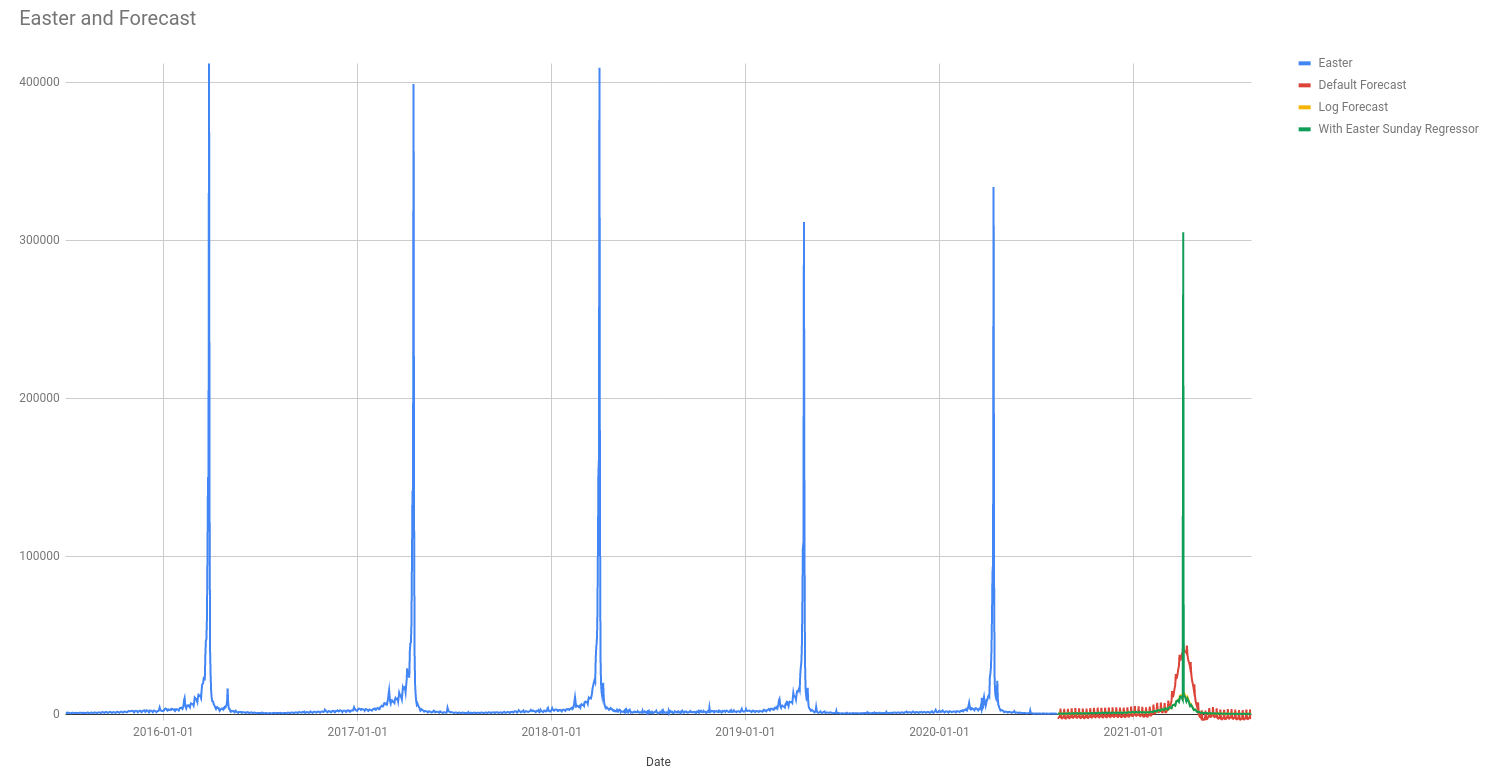
Comparing our new forecast with the old and with what happened in Easter 2020 shows that there is still a long way to go before we have a forecast that looks right.
The log transform has help with the forecast for the rest of the year; the weekly spikes that you can see on the red line are muted on the yellow, and it never forecasts a negative number. But the forecasted traffic levels around Easter are much lower.
I will show you how to fix these problems in the next section on Regressors
Regressors
A regressor is a column of extra data which helps the machine learning algorithm make its predictions.
A good regressor has the following properties:
- It is correlated with the thing you want to forecast.
- Either you know what it will be in the future or you are able to make better predictions about what it will be than you are for the thing you want to forecast.
A good example of a regressor is paid search budgets when you are forecasting paid search clicks, conversions or revenue. The amount you spend is quite well correlated with the ouput and you have a good idea what your budgets will be in the future.
You can also create regressors for special events like sales or the launch of new product lines; as long as you know when these things occured in the past and when they will occur in the future.
I will teach you this approach to help improve our Easter forecast.
                   ┌──────────────────┐
                   │       Data       │
                   └──────────────────┘
                     │
                     │
                     ▼
┌────────────┐     ┌──────────────────┐
│ Regressors │ ──▶ │ Machine Learning │
└────────────┘     └──────────────────┘
                     │
                     │
                     ▼
                   ┌──────────────────┐
                   │     Forecast     │
                   └──────────────────┘
A regressor for Easter Sunday
Start with the simplest thing that might work.
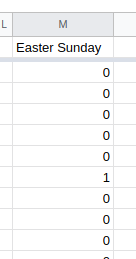
Here I have created a new column with a zero on every day except for Easter Sunday where the value is one.
This tells the algorithm that there is something very special about Easter Sunday so it should predict differently for 4th April 2021.
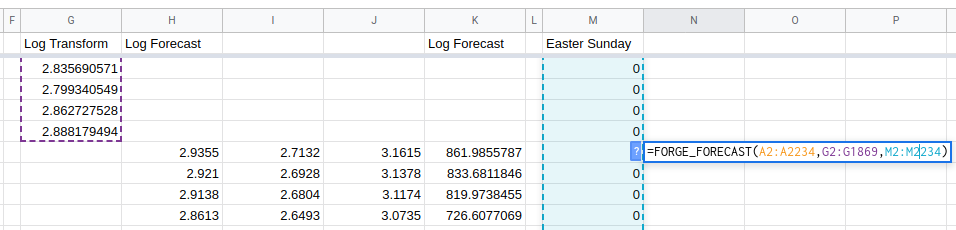
To use a regressor in the FORGE_FORECAST custom function just insert
the regressor range as the third argument.
In the example spreadsheet, the Easter Sunday regressor column is in column M
so the formula is:
=FORGE_FORECAST(A2:A2234,G2:G1869,M2:M2234)
NB: we are still using the log transformed values.
Adding a Lent effect
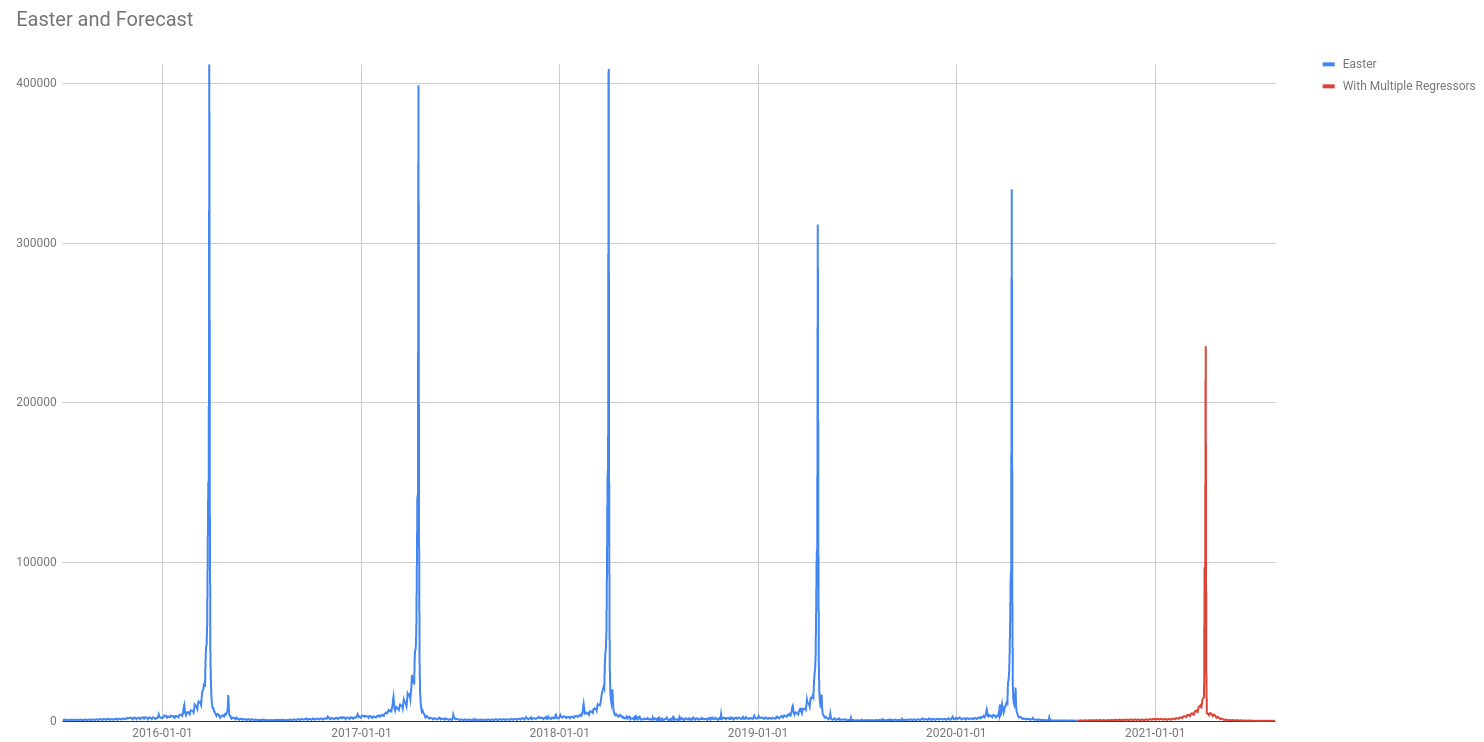
The chart above shows a big improvement in the forecast; it looks much more like the trend we have seen in past years.
The forecast algorithm automatically looks for annual and weekly trends but Easter is confusing because Easter Sundays are not 365 days apart. By adding the regressor column we have given the algorithm enough of a hint to figure out what is going on.
Comparing what our forecast looks like with the trend in previous years it looks like the algorithm is not really learning about the uptick in pageviews during Lent.
Next I will add extra regressor columns to help the algorithm with this.
There are a few different ways you could do this. I will do the following and let the algorithm figure out which one (or which combination) of them it uses:
- A binary indicator for the forty days of Lent. This will be just like the Easter Sunday regressor except there will be a one for every day of Lent rather than just on Easter Sunday.
- A binary indicator for the Easter Weekend starting on Good Friday and finishing on Easter Monday.
- A “countdown” to Easter starting on Shrove Tuesday. The idea here is to show how interest in Easter increases through Lent; our first indicator above is not this subtle.
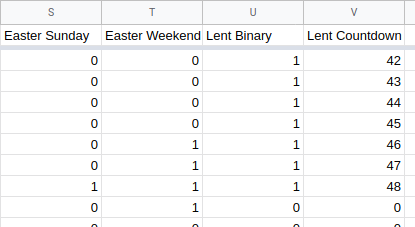
Using multiple regressors is very similar to working with only one regressor column; just use a range when calling the function.
In this example, the regressors are in columns S, T, U and V so the
formula is:
=FORGE_FORECAST(A2:A2234,G2:G1869,S2:V2234)
It is the range S2:V2234 which specifies the regressors.
Running the forecast and doing the inverse transform on the result ends up looking like this:
Automatically Adding Holidays
All this must look like quite a lot of work.
It is probably worth it for a business where Easter is an extremely important time of year, but to have to go through this for every movable feast (Thanksgiving and Black Friday are also not on a 365 day cycle!) doesn’t look worth it.
Luckily there is an easier way!
In the FORGE_FORECAST function you can specify a country code
which will automatically add regressors for holidays that are celebrated in
that country.
In this example the formula is
=FORGE_FORECAST(A2:A2234,G2:G1869,,"US")
Notice that the regressors have been left blank (the double comma ,,).
You can still use regressors here if you want to.
The results are OK:
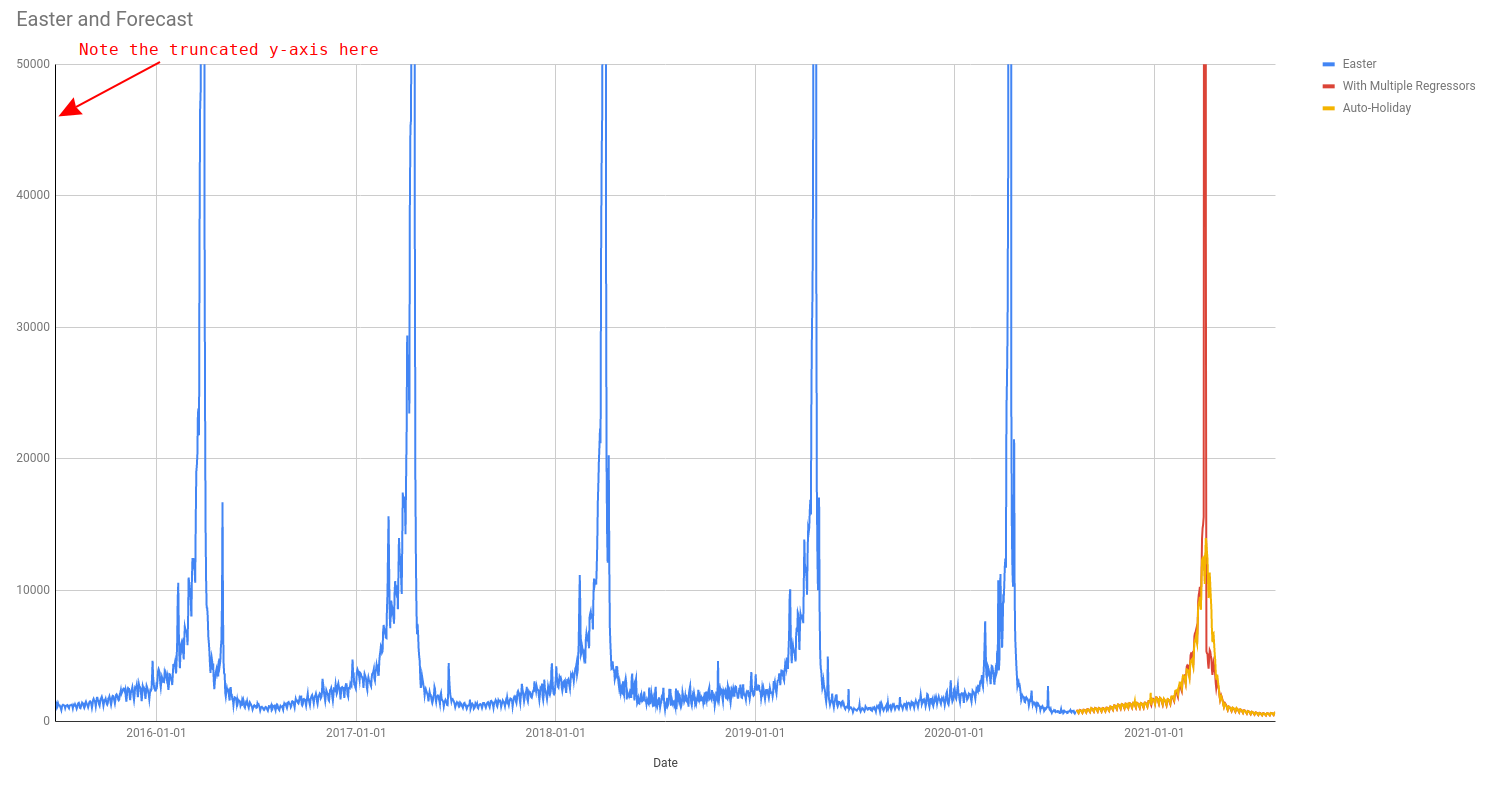
The auto holiday feature works well in general but, as you can see in the plot above, it doesn’t quite capture the crazy effect of Easter Sunday on the pageviews of the Easter page.
If are making a forecast for a similar metric, where one part of the year is way more important than the others, then I advise you to use custom regressors as in the examples above.
Do you have any more questions about how to get the most out of your data?
Ask Me!