Custom Functions for Growth Trends
January 13, 2022If you already know what this is about and why you might want to use it then skip the motivation and go straight to the Documentation. Otherwise, read on…
Motivation
A good place to start with Forecast Forge is to make a baseline forecast. You can think of this as a “this is what we think will happen if things keep going as they are” prediction.
Then, if you’ve setup the right regressor columns, you can start to make predictions for the future based on different regressor scenarios; for example:
- What if we grow our email list by 30%
- What if we reduced our media spend during May?
- What if the covid rules change again?
But there are some cases where you can’t use this approach. All machine learning forecasts need historical training data that it can use to make estimates about what will happen in the future. If you are going to do something that you’ve never done before then, by definition, there is no training data so machine learning won’t help very much!
This is very common when agencies are asked to forecast growth for new clients; the agency pitch is going to be “we will do something for you that either you haven’t done before or we’ll do it in a different and better way” so there is no training data for this.
[The ML approach here is to use data from other new clients as the training data under the assumption that performance for client A will be similar to clients B through Z. How well this works will depend on how similar the clients are. I might discuss this method some other time; it isn’t easy to do well in Forecast Forge]
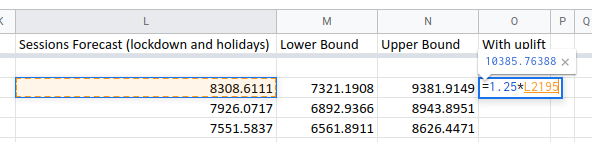
The usual approach, particularly for an SEO forecast, is to do an analysis of the client website and how strong the competition is then use this to predict the total amount of growth that is expected for a client. For example, a quick audit might spot a few opportunities on a client sites which combined with an analysis of the relative strength of their and their competitor’s link profiles causes an SEO to say “I think that we can grow traffic here by 25% in a year”.
You can layer this estimate on top of a Forecast Forge forecast by multiplying
every forecasted value by 1.25:
All holiday country codes
October 13, 2021Below is a list of supported countries and their ISO code for the Forecast Forge holiday database.
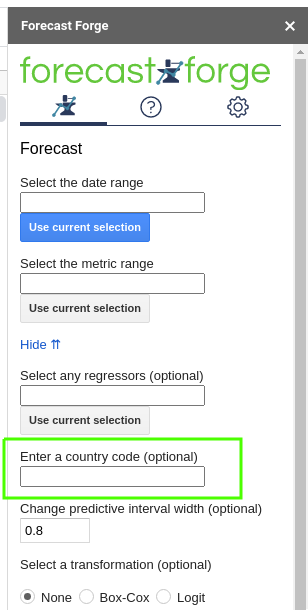
Find the country you want in the table and then enter the ISO code in the
sidebar or as the fourth argumnent to FORGE_FORECAST
| Country | ISO code |
|---|---|
| Argentina | AR |
| Aruba | AW |
| Australia | AU |
| Austria | AT |
| Bangladesh | BD |
| Belgium | BE |
| Brazil | BR |
| Canada | CA |
| Chile | CL |
| China | CN |
| Colombia | CO |
| Croatia | HR |
| Czechia | CZ |
| Denmark | DK |
| Dominican Republic | DO |
| Egypt | EG |
| Estonia | EE |
| Finland | FI |
| France | FR |
| Germany | DE |
| Greece | GR |
| Honduras | HN |
| Hong Kong | HK |
| Hungary | HU |
| Indonesia | ID |
| Iceland | IS |
| India | IN |
| Ireland | IE |
| Israel | IL |
| Italy | IT |
| Kenya | KE |
| Lithuania | LT |
| Luxembourg | LU |
| Malaysia | MY |
| Mexico | MX |
| Morocco | MA |
| Netherlands | NL |
| New Zealand | NZ |
| Nicaragua | NI |
| Nigeria | NG |
| Norway | NO |
| Paraguay | PY |
| Peru | PE |
| Philippines | PH |
| Pakistan | PK |
| Poland | PL |
| Portugal | PT |
| Russia | RU |
| Singapore | SG |
| Slovakia | SK |
| Slovenia | SI |
| South Africa | ZA |
| Spain | ES |
| Sweden | SE |
| Switzerland | CH |
| Turkey | TR or TU |
| Thailand | TH |
| United Arab Emirates | AE |
| United Kingdom | GB or UK |
| United States | US |
| Vietnam | VN |
Adding Weather Data to Forecasts
September 22, 2021A lot of different types of business are influenced by the weather. Some ecommerce sites see an uptick during bad weather when more people are looking at their screens. Other businesses sell products that customers only start thinking about buying during certain weather conditions; this can range from barbecues at one end of the scale to hats and gloves at the other. You can probably think of a few other interesting examples from your own experience.
Adding historic weather data to your forecast can help quantify the link between weather conditions and business outcomes and it can also help make for a better forecast for the future. For example if you sell a lot of barbecues on the first hot weekend in May then, without the weather data, the forecasting algorithm can’t know what has caused this and will see a lot of random variation. This random variation is assumed to continue in the future so you will end up with:
- A forecast that does not take into account the weather forecast
- A forecast with a wider predictive interval than necessary
Weather data can be a very useful addition. Forecast Forge now provides some custom functions to help you include this in your forecasts.

Anomaly Detection in Google Sheets
January 29, 2021
What is Anomaly Detection?
Anomaly Detection is identifying “anomalous” data.
Usually it means using machine learning to identify outliers but you can do anomaly detection with any v1.0 human eyeball too.
Aside from all the complexities of machine learning an important difficulty is knowing what an anomaly is. Sometimes it is entirely expected to have some data that is very different to the rest.
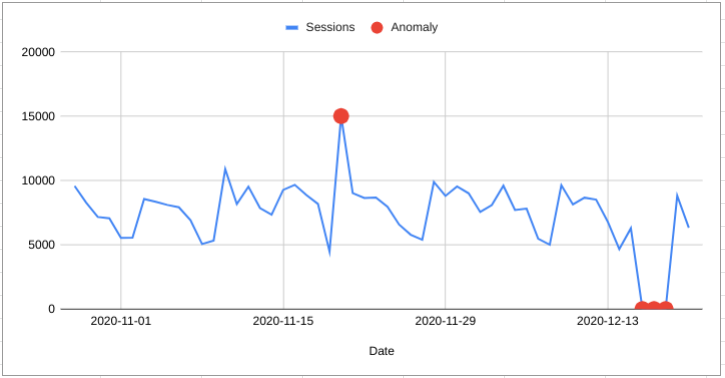
Forecast Forge is focussed on timeseries data; data where each observation is associated with a specific time. An anomaly is then where an observation is very different from what we would expect given the trend and seasonality in the data.
Scheduled forecasts and Google Data Studio
January 21, 2021Because Forecast Forge works as part of Google Sheets you can include Forecast Forge forecasts in your Data Studio reports. And with addons like the official Google Analytics spreadsheet addon you can schedule these reports to update and run automatically.
Here’s how it works
First you will need to get setup with the Google Analytics spreadsheet addon. You can do this easily be following the instructions.
Once you have the addon installed you can create a report in the sidebar:
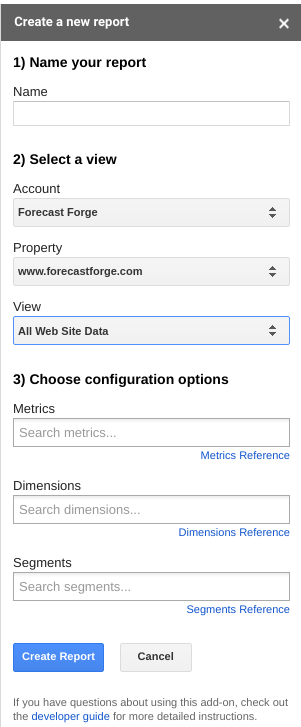
For Forecast Forge you must have date as a dimension. If you add other
dimensions you’ll have to do some funky spreadsheet wizardry to get everything
formatted correctly but I’m sure that is possible.
Once you’ve created the report the addon will create a new sheet called “Report Configuration” in your spreadsheet that looks a bit like this:
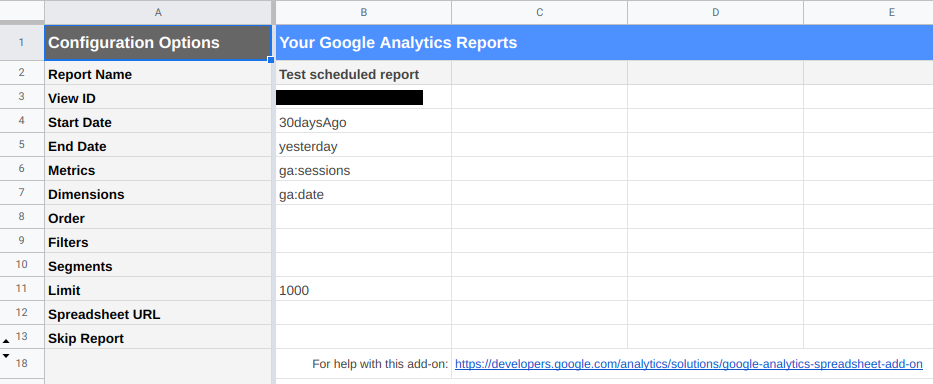
There are a few edits you will probably want to make to this sheet:
- The start date
- The number of rows returned
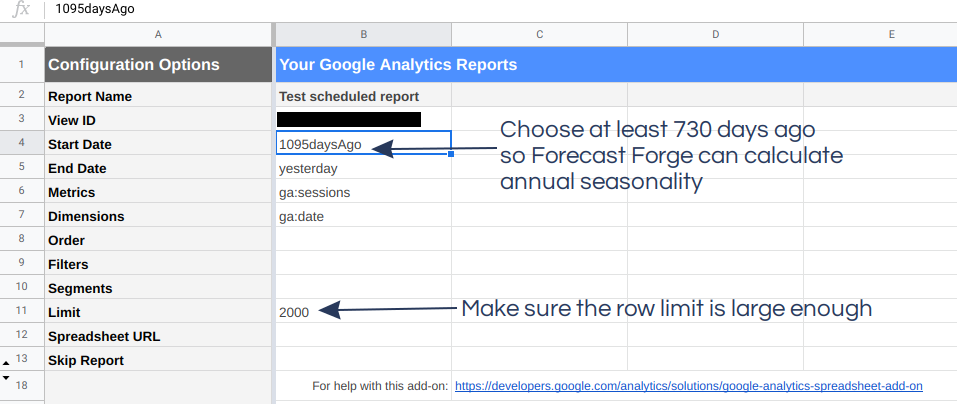
The start date can be a specific date (e.g. 2020-01-01) or NdaysAgo where
N is a positive integer. You can also use Sheets formula to configure the date
if you want (e.g. =EOMONTH(TODAY(), -1)).
Using a fixed start date vs. a variable start date changes how the forecast can be used. I’ll start by showing you a variable start date example in this tutorial.
When you have finished the configuration, click “Run Report” in the menu to pull the data into Google Sheets.
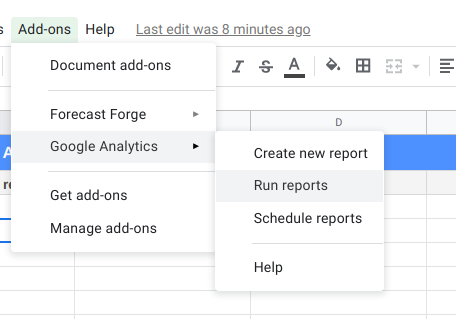
The addon will create another new sheet and you should see it populated with some lovely Google Analytics data.
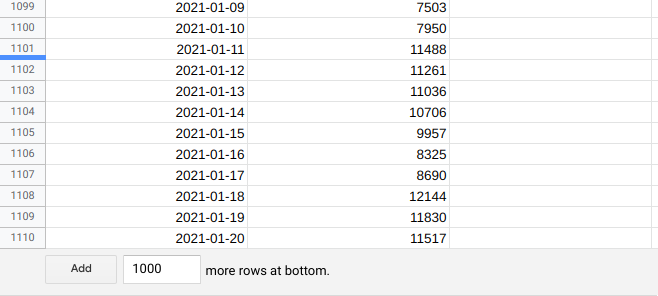
If you scroll to the bottom of the sheet you will notice that the date fills the sheet right to the end.
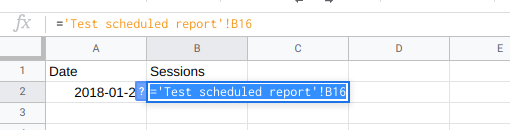
To keep things clean and separate I prefer to make the forecast in a separate sheet.
Because the Google Analytics data will always contain the same number of days (this will get a lot more complicated if you add other dimensions!) it is easy to pull the dates and metrics into another sheet:
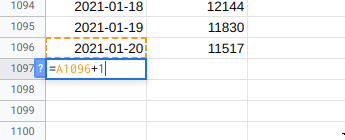
Then extend the dates column into the future for as many days as you want to forecasts:
Then make your forecast. For the scheduled updates to work you must use the custom functions for this rather than the sidebar. I suggest you follow my forecasting workflow to figure out what makes the best forecast for your data and then implement it using the custom functions.
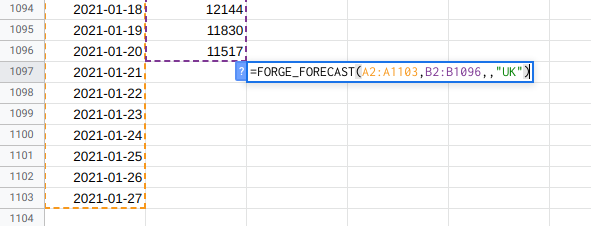
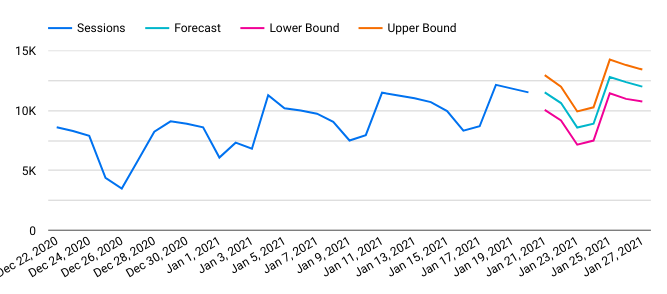
When the forecast has run it should look something like this:
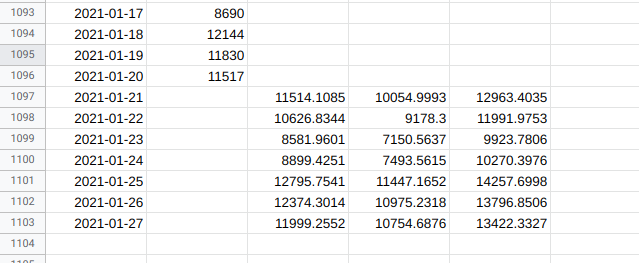
Label the forecast columns in row 1 if you are later going to import this into Data Studio.
Next setup the scheduled update:
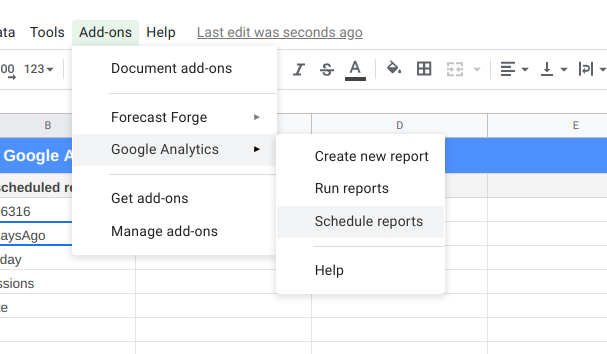
Running hourly won’t help you very much but you can select daily, weekly or monthly for automatic updates.
Import into Data Studio
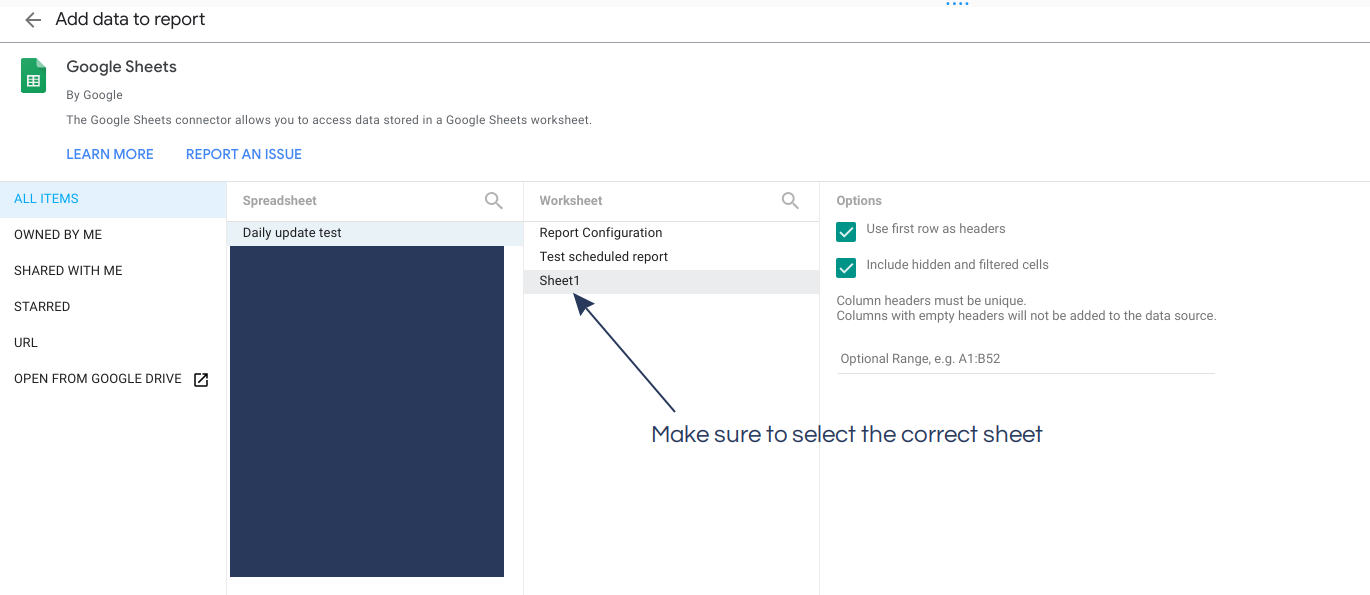
In Data Studio you need to setup your Google Sheet as a new data source:
And then add the columns from the sheets as metrics for display:
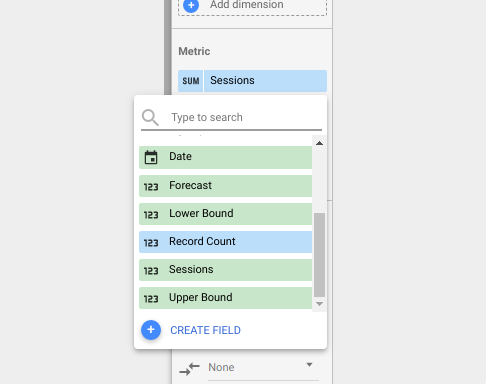
Make sure you add the metric (in this case Sessions) and the forecast
(Forecast). You can add the upper and lower bounds too if you want them
included in your report.
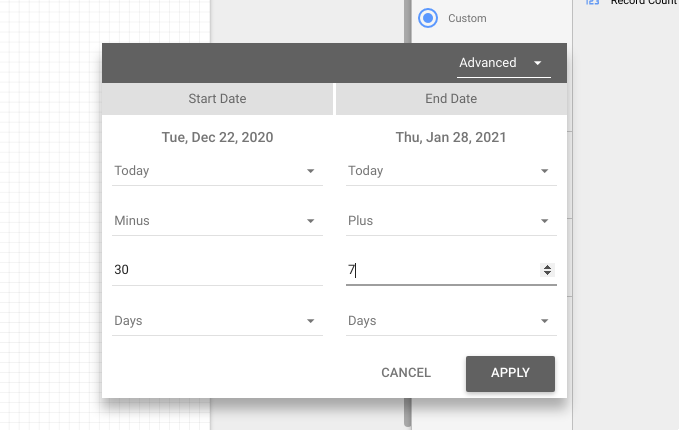
I like to restrict the date range of the Data Studio report so that the viewer doesn’t have to see all the training data; they can just see the most relevant parts. Remember to extend this date range into the future to include the forecast.
Using this you will be able to produce tables and charts that contain both historical data and the forecast from your Google Sheet. These will update when the Google Sheet updates on the schedule you specified earlier.